In one of my earlier post, I analyzed the Shark Tank data to gain some insights on the distribution of deals among industries and presenters’ genders. In this post, I want to present a more visual exploration of the data as a way to also gain more practice using R’s Shiny package.
There is nothing sophisticated in the visualization App itself, there is a UI and a Server part that allows you to visualize information regarding the deals that have been made on Shark Tank.
The App has been made available here, and the code for the App can be found here.
The right-hand side of the App displays a scatter plot showing all the companies that have gotten deals. The y-axis shows the deal amount, while the x-axis shows the equity that was given in the deal.
Upon hovering on each point, you get more information, including the Name of the company that got the deal and the Valuation amount. The deals are also colored by the Industry it belongs to.
Screenshot of App
On the left-hand side, the App allows you to select:
– The maximum deal amount – whereby the App responds to show you all the deals made under that amount.
– The Season – the App shows you only the deals made in that season. I have only added 3 seasons worth of data, but more seasons can easily be added to the csv file and will be reflected accordingly in the App.
– The Gender – the App shows you only deals where the presenters are of that selected gender.
As future work, it will be good to allow the user to make a selection and see deals made by a particular Shark on the show.
Last week, I lead the second session of the Finland-Uganda Data Science Meetups. The topic for this session was data import, cleaning and pre-processing, and visualizations.
In the session, we welcomed senior data scientist, Jukka Toivanen, who shared with us the importance of good communication and visualization skills in data science. With the image below, he outlined to us the three spheres that make up the major part a data scientist’s work.
Data scientist’s work areas (source: Jukka Toivanen)
In those three areas, he pointed out that there is a tendency of data scientists to focus on the comfort zones, i.e., the blue and purple spheres. With the red sphere often not being focused on so much.
“Effective communication is undervalued but important” – Jukka Toivanen
But communication is important and it often means the use of good visualizations, as they can have remarkable effect in spotting patterns and conveying them effectively to other people.
I also recently got to learn the importance of this skill in an interview with a company for a data scientist position. The company gave me a task that involved developing a predictive model on a dataset, with the additional task of presenting key findings to a CEO. Guidelines were that the presentation should be maximum 10 slides, be visually appealing and should be top notch. My performance on the task would be based (not solely) on my presentation, i.e., communication skills.
Although, I have undertaken several presentations in my career, this task did challenge me. As an audience, executives are a special group. They have limited time and want to hear meaningful results quickly. Thus, my first two slides had to already catch their interest. In addition, with visualizations, I had to communicate two to three important findings, insights and action points that had the most business value. To do this well, required learning as much about my audience’s business as I could and their potential business model. This paid off in the end as I was commended on my impressive presentation.
Often though, good visual presentations is not something that is emphasized in many data science school programs, let alone computer science programs. But it is important to learn how to effectively communicate and visually connect the technical approaches and results to the business value. This skill I believe will take data scientists a long way in creating impact.
1. distribution of nations in Africa (where I am from), Europe (where I am currently living) and Asia (where the economic freedom leading countries are) among the 5 categories of freedom, and
2. correlations between economic variables to see if any insights can be gained from this data.
In this post, I explore the
3. relationship between economic freedom, government expenditure and unemployment rates.
and summarize the findings and give recommendations.
The aim of this data exploration is to obtain insights and identify potential areas for improvement, especially for African nations. For the analysis, I used python. Full code is available on github.
Relationship between economic freedom, government expenditure and unemployment
Reducing unemployment is something that personally interests me. Thus in this post I focus on the relationship between the economic freedom, government expenditure and unemployment rates as a percentage of the labor force. Previous work has stated that government spending should go towards improving economic situations including employment levels (read John Maynard Keynes’ work).
According to the 208 Index data, the average unemployment rate is 10.08% in Africa, in Europe it is 9.8% and in Asia-Pacific it is 5.1%, the lowest among the three regions. The graphs below plot the economic freedom score vs unemployment rate data points and show the trend as well as their distributions.
Trend in Africa. As can be seen in the graph below, there is a slight upward trend between the economic freedom score and unemployment rate in Africa which is not the case in the European and Asia-Pacific graphs (see below). In the graph we also see several countries with similar economic freedom scores (scores between 50 and 60) but have very varying unemployment rates. The highest unemployment rate is present in Gambia at 29.7%. while the lowest is in Benin at 1%.
Trend in Europe. In the graph below, we see that there is a downward trend between the economic freedom score and unemployment rate in Europe. A bit interesting, the lowest unemployment rates is found in Belarus at 0.5% but Belarus is categorized as moderately unfree. The highest unemployment rate of 26.7% is in Macedonia.
Trend in Asia-Pacific. Asia-Pacific also has a downward trend between the economic freedom score and unemployment rate. The region has some of the lowest unemployment rates when compared to the Europe and Africa regions. However, the highest unemployment rate is 31% in the Solomon Islands, the highest rate also when compared to those nations in Europe and Africa. The lowest unemployment rate is 0.3% in Cambodia.
Now, looking at the government spending, the average African government spending (graded on a scale of 0 to 100 in the Index) is 72.69, whereas it is 45.05 and 68.51 in Europe and Asia-Pacific respectively. Thus, the government spending in Africa is considerably higher. Moreover, the average government spending as a share of the GDP per person (an indicator of the size of government across countries (source)) is at 25 in Africa, which is higher than both Hong Kong (18) and Singapore (17.7) which are the first and second nations respectively in the economic freedom rankings.
Thus looking at the level of spending in Africa, and other variables such as unemployment rates or the economic freedom score, we can see that it is not the amount of spending that only matters to improve the economic freedom but the quality of the spending. “Things like the rule of law and a relatively corruption-free political culture—is more important than their size.”Stephen Gordon. As was pointed in the Index report, African nations need to strengthen their rule of law, protection of property rights, and curb down on cronyism and corruption.
Thus, spending itself is not the solution to reducing unemployment rates or improving the economic freedom score. The best results are likely to be achieved instead through strengthening and encouraging more business freedom, trade freedom, investment and financial freedom, aspects that create opportunities.
Summary
Part I and this post have explored the 2018 Index of Economic Freedom data, in particular looking at the Africa, Europe and Asia-Pacific specific data. The findings have revealed relationships, similarities and differences among the three regions. The aim of the exploration was to gain insights and identify potential areas for improvement, especially for African nations.
From looking at the correlations, it was possible to identify areas that could be worked on by African economies. This can include creating policies to improve regulatory efficiency (business freedom, labor freedom, and monetary freedom) and create market openness (trade freedom, investment freedom, and financial freedom), policies that can provide the best chance of translating opportunity into prosperity.
In future, I aim to expand on the analysis to include more data sets (public and private sector) that can hopefully provide even more insights.
According to the 2018 Index of Economic Freedom, released by the Heritage Foundation, the world is moderately free. The Index, which was launched in 1995, evaluates nations on 12 aspects that affect economic freedom. These are grouped into four broad policy areas; 1) Rule of law (property rights, judicial effectiveness, and government integrity); 2) Government size (tax burden, government spending, and fiscal health); 3) Regulatory efficiency (business freedom, labor freedom, and monetary freedom); and 4) Market openness (trade freedom, investment freedom, and financial freedom).
Each freedom variable is a value between 0 and 100. Values of these 12 freedoms are averaged to create an overall economic freedom score. Based on this score, nations can be classified into five categories: free (>= 80), mostly free (70-79.9), moderately free (60-69.9), mostly unfree (50-59.9), and repressed (< 50).
Those economies that are rated free or mostly free enjoy higher per capita incomes than the many other nations that are not economically free. Examples of these free nations include Hong Kong and Singapore which have been leading in the rankings for several years.
Using the 2018 Index data, I explore the:
1. distribution of nations in Africa (where I am from), Europe (where I am currently living) and Asia-Pacific (where the leading countries are) among the 5 categories of freedom,
2. correlations between economic variables to see if any insights can be gained from this data, and
3. relationship between economic freedom, government expenditure and unemployment rates.
The aim of this data exploration is to obtain insights and identify potential areas for improvement, particularly for the African nations. The analysis on the Finland-Uganda Data Science Meetup, Session 1 that I instructed on the 29th March. The session explored the relationship between African nations’ government expenditure and unemployment rates using simple linear regression.
I have split the analysis and results into two posts. This post, Part I, covers the 1st and 2nd exploratory items mentioned above. Part II covers the 3rd item and summarizes the findings and gives recommendations. For the analysis, I used python. Full code is available on github.
Categorization of nations
As mentioned, the economic freedom score can be used to categorize the nations. Figures below show the distribution of the nations into the five categories of freedom.
World nations categorization. A total of 180 economies were ranked in the 2018 Index, and have an average score of 61.07 (Moderately free), a slight improvement of 0.17 points from the previous year. This is also the highest score in the 24-year history of the Index. From the chart below we can see that majority of the World’s nations fall in the moderately free and mostly unfree categories.
African nations categorization. Total of 53 economies were ranked in the 2018 Index, and have an average score of 54.46 (Mostly unfree), a slight drop of 0.49 points from the previous year (54.95). The graph below shows the distribution. Visible is that the distribution skews more to the right with majority of the nations being mostly unfree. Noticeably there are no African nations that are considered free. Mauritius is the only mostly free nation, with Botswana falling short of that category by only a 0.2 point drop from 2017, causing it to drop into the moderately free category.
European nations categorization. Total of 45 nations were ranked in the 2018 Index, and have an average score of 68.78 (Moderately free), a slight improvement of 0.80 points from the previous year (67.98). Majority of the nations in Europe are moderately free. Noticeably, Europe has zero nations that are considered repressed.
Asia-Pacific nations categorization. A total of 43 nations were ranked and have an average score of 61.05 in 2018, a bit higher than the average of 60.43 in 2017. Asia-Pacific leads in the number of countries that are considered free, with a total of four nations. Majority of the countries are however mostly unfree.
Correlations among the 2018 Index economic variables
The 2018 Index data includes 28 numerical variables which include the 12 freedoms, as well as other variables such as GDP per Capita, Unemployment rates, inflation, or public debt.
The heatmaps below reveal the correlation coefficients, i.e., the relationship between these variables in the African, European and Asia-Pacific regions. Looking at the heatmaps, we can see those variables that are positively and negatively correlated.
Correlations of variables in African nations (download image)
Correlations of variables in European nations (download image)
Correlations of variables in Asia-Pacific nations (download image)
From the heatmaps, what is immediately visible, is the higher amount of positive correlations on the Europe and Asia-Pacific heatmaps. In all three regions, there is higher positive correlation among the Rule of law economic variables, i.e., property rights, judicial effectiveness, and government integrity. With the Asia-Pacific and European heatmaps, one can see that higher positive correlations also exist in the Regulatory efficiency (business freedom, labor freedom, and monetary freedom) and Market openness (trade freedom, investment freedom, and financial freedom) variables. In Asia-Pacific particularly, these three categories are all highly correlated to the economic freedom score. Of course correlations do not imply causality, but this does highlight areas such as regulatory efficiency and market openness that African nations can work on and create policies that have a positive impact on the economic freedom score.
An aspect that further interests me is the relation between economic freedom and employment opportunities for citizens. In the next part, I particularly look at the relation between economic freedom and government expenditure and how these relate to unemployment rates in African, European and Asia-Pacific nations.
In April 2014, my colleagues and I published an article in the IEEE Transactions on Affective Computing journal titled “Are They Different? Affect, Feeling, Emotion, Sentiment, and Opinion Detection in Text.” In writing the paper, I didn’t know that it was going to end up being one of one my most read and cited paper.
The paper made a case that the following five subjective terms should be differentiated for their effective detection in text: affect, emotion, feeling, sentiment, and opinion. In the field of subjective detection, a major limitation in the automatic detection of affect, feelings, emotions, sentiments, and opinions in text is the lack of proper differentiation between these subjective terms and understanding of how they relate to one another. This lack of differentiation, also influences real-world text analysis applications.
In the paper, I tried to bring clarification to the terms and highlight the distinctions and relationship between them, first at a definition level, and then at a more structural level so as to allow for the detection of those terms in text. The definitions and structural differences that were identified are summarized below.
Affect is non-conscious and is difficult to conceptualize in language, revealing that what can be detected from text is the conscious expression of affect, which was found to be feelings and emotions. What is normally or can be detected in text is rather the affective reaction expressed towards something.
Feelings are conscious phenomena that have been labeled and they can be detected from text.
Emotions are complex psychological phenomena that are near impossible to detect in totality from text. What we are able to detect is the written conscious experience of five factors (appraisals, feelings, physiological reactions, expressive behavior, and readiness to act in a certain way), which constitute emotions. I also found that the use of words to convey emotions is influenced by culture. Thus the paper further recommend the inclusion of ethnographic studies to answer questions such as “What role does culture play in the linguistic expression of emotions?” Answering that would enable natural language processing researchers to create more robust emotion detection algorithms.
Schematic structure of an emotion
Sentiments are enduring emotional dispositions that have developed over time about particular objects. Conclusions about sentiments in text have to be performed for a period.
Schematic structure of sentiment
Opinions are personal interpretations of information, which may or may not be associated with an emotion or sentiment. The paper gives examples of such instances.
Schematic structure of an opinion
From the definitions and structures above, it is clear to see the differences between the subjective terms. The terms are however related to each other as the figure below illustrates.
Relation and differentiating factors between affect, feelings, emotions, sentiments and opinions.
In summary, to reach their full potential, natural language processing techniques focused on detecting subjective terms must be able to capture the subtle differences that reflect personal, cultural, and societal signals within the subjectivity terms. In the paper, I only focused on five terms, but there exists others that are related such as mood and attitude.
The existence of these related concepts is one of the reasons I did this research. In particular, I wanted to use the results as building blocks for building a common framework for capturing all the subjectivity terms in text. This is something I still have the desire to do and something that is still an open question on whether its possible or even needed. Perhaps, the current advances in word embedding techniques would be one approach to capture not only the semantic relations but the affective relations between words, sentences, or documents. Thus if there are any interests out there on investigating this common framework for detecting subjectivity in text, please drop me a line.
One of my areas of interest and expertise is emotion detection. In this post, I look at the existing theories of emotion, in particular the assumptions and limitations they set on the detection of emotion in text. In the literature on emotion detection, no unified or generally accepted theory of emotion exists. However, there are six theories that have had a significant impact on the field of emotion detection research. I briefly review each of the six theories, then look at the assumptions each theory contributes particularly to the natural language processing of emotions in text. For a more thorough discussion, see my dissertation (Chapter 2).
Theory 1: Darwin’s evolutionary theory
The first theory of emotion can be traced to Charles Darwin’s evolution theory of emotion in 1872 [1]. Darwin’s theory focuses on the nature of emotion expression, and it states that non-verbal communication, such as body language, movements, and facial expressions, are not only used to communicate meaning but have also been genetically retained because they were useful to ancestors. Darwin also suggested that emotional expressions are initially learned behaviors. The main emphasis of the theory though is the “survival value” of emotions, particularly their universal similarity across races and cultures (illustrated in Figure below).
Sequence of Darwin’s theory emphasizing the survival factor leading to emotion expression.
Theory 2: James-Lange theory
In his 1884 article, “What is an Emotion?”, James argued that bodily changes must come first and that it would be impossible to have emotions without these bodily changes [2]. Similarly, Carl Lange, a Danish professor, emphasized the influence of vasomotor changes to emotional experiences [3]. Because the two scientists similarly emphasized that physiological arousal precedes emotions, their two theories were combined to form one theory, known as the James-Lange (J-L) theory. The theory states that physiological arousal occurs first, and when this arousal is perceived or interpreted, emotion is experienced (illustrated in Figure below). In other words, a stimulus triggers physiological changes in a person’s body, and a person’s brain interprets these physical changes into the appropriate emotion [4].
Sequence of J-L theory emphasizing the importance of physiological arousal for an emotion experience (adapted from Walsh [5])Theory 3: Cannon-Bard theory
The Cannon-Bard theory argues against the J-L theory and states that physiological arousal, such as sweating and trembling, occurs simultaneously with emotions. The theory argues that the thalamus is a necessity for experiencing emotion. According to the theory, the thalamus sends messages to the cortex for an interpretation of the emotion, which then generates the subjective feeling of emotion, and simultaneously sends them to the sympathetic nervous system for the appropriate physiological responses, thus producing arousal at the same time [6, 7] (illustrated in Figure below).
Sequence of the Cannon-Bard theory emphasizing the simultaneous occurrence of physical arousal and emotion (adapted from Walsh [5])Theory 4: Schachter-Singer theory
Like the Cannon-Bard theory, the Schachter-Singer theory [8] acknowledges that the same pattern of physiological arousal can occur for different types of emotions. Similar to the J-L theory, the Schachter-Singer theory also states that physiological arousal occurs first and provides important feedback for interpretation; however, rather than simply perceiving or interpreting the arousal, Schachter-Singer’s theory suggests that a reason for the arousal must be identified before being able to experience an emotion (see Figure below).
Sequence of the Schachter-Singer theory emphasizing physical arousal and cognitive labeling of the arousal to experience an emotion (adapted from Walsh [5]).Theory 5: Cognitive-Appraisal theory
The focus of the cognitive-appraisal theory is that thought and emotion are inseparable [9]. According to this theory, to experience an emotion and respond to it, one must think about the situation they are in. The theory is often believed to provide the missing link that explains the interpretation or perception in the J-L theory. Interpretation is thus explained by cognition, more particularly by appraisal, a term coined by Arnold [10] to represent sense judgments, which are “direct, immediate, nonreflective, nonintellectual, [and] automatic.” Theorists of this perspective, pointed out that depending on the significance for the individual, the appraisal of a situation will automatically trigger an emotion and physiological response as an appropriate response to the stimuli, which can either be immediate, imagined, or remembered [11] (illustrated in Figure below).
Sequence of the Cognitive-Appraisal theory emphasizing the importance of cognition (appraisal) before emotion experience and response (adapted from Walsh [5])Theory 6: Social constructivist theory
Social constructivists view that “emotions are not just remnants of our phylogenetic past, nor can they be explained in strictly physiological terms. Rather, they are social constructions, and they can be fully understood only on a social level of analysis.” [12]. The theory focuses on the systems of culturally specific rules that govern how, when, and by whom particular emotions are to be experienced and expressed [9] (see Figure below). From this perspective, emotions fulfill a social purpose by regulating interactions between individuals. Although the theory differs from Darwin’s and James’ theories, those who support Darwin’s theory have acknowledged the role of culture in regulating emotional displays [13].
Sequence of the Social Constructivist theory. emphasizing the importance of culture and social norms in emotion expression.
Discussion on the assumptions each theory contributes to emotion detection in text
Each of the above six theories agree that emotions are triggered by a stimulus or event (external or internal) that is deemed important to the organism. The theories can be grouped into five main categories: evolutionary, physiological, neurological, cognitive-appraisal, and social constructivism [14]. Although the theories seem to contradict one another, they actually focus on different perspectives of emotions, which Cornelius [14] summarized as follows:
“Neurophysiologists are interested – almost by definition – in the neural organization of emotion, Darwinians are interested in the evolutionary organization of emotion, Jamesians [those following the James-Lange theory] are interested in the bodily organization of emotion (for want of a better term), cognitive-[appraisal] emotion theorists are interested in the psychological organization of emotion, and social constructivists are interested in the social-psychological and sociological organization of emotion.”
With these theories, a natural language processing researcher in emotion detection has to determine which theories and their assumptions provide the most suitable basis for describing emotions in the context of their research.
With the Darwin’s theory, it can be assumed that there are universally recognized facial expressions present when experiencing emotions. It can also be assumed that there are body movements or reactions that are primary in every living being [15]. From this perspective, and considering a textual environment, evidence of facial expressions would be present in texts in descriptions of the face, i.e., “I have sad face” or “she is smiling at me,” or in the use of symbols, e.g., emoticons. Otherwise, there would be no evidence of facial expressions in a textual environment, and thus the emotion could not be identified in accordance with the theory. Hence, the Darwinian Theory is more suited to studies that have access to visual signals.
From the perspective of the J-L theory, it can be assumed that an emotion experience is accompanied by unique patterns of physiological activities, i.e., changes in the autonomic nervous system. In the textual environment, expressive and descriptive words may provide evidence of physiological arousal, as it is not possible to use equipment to measure physiological signals. For example, descriptive phrases such as “my palms are sweating” in reference to nervousness or “I am finding it hard to breathe” in reference to panic provide self-physiological activity descriptions; however, the theory is limited to only subjective feelings which is the component of emotion that the J-L theory focused on [16].
Moreover, based on the neurophysiological perspective, which was represented by the Cannon-Bard theory in the review above, it can be assumed that there are activities in the nervous system that cause some of the emotion experiences and the accompanying physiological arousals. In particular, the emotion experience can occur without an awareness of bodily changes. That is, people can react to the emotional significance of a stimulus before fully understanding the stimulus [17]. The theory also assumes that there are neural circuits that have developed evolutionarily [18]. From a text perspective, this theory makes it more difficult to determine how the nervous system’s activities make assessments of a stimuli because it would be overly complicated to use circuit models as a means to differentiate one emotion from another in text.
From a cognitive-appraisal perspective, which includes the Schachter-Singer theory, it can be assumed that each emotion experience has its own corresponding and unique pattern of appraisal, thought, and mental activity. More specifically, following from the Schachter-Singer theory, it can be assumed that an emotion has been labeled and recognized by an author of a piece of text. As cognitive-appraisals arise from personal conceptions of a situation, identifying an emotion experience becomes a complex task to perform because the uniqueness of each pattern makes it difficult to evaluate it across different people [19]. This challenge is particularly difficult in a textual environment because detailed information is not often available.
Furthermore, from the social constructive perspective, it can be assumed that there are cultural and social factors in play during emotion experiences and expressions. Social processes and cultural norms play significant roles in specifying when emotions are felt and how emotions are expressed [19]. Some emotions are directed towards other people and arise from interactions with them. Although it is apparent that social and cultural norms do affect emotion expression and that there is a need to study emotions in a social context, it is a challenging task in a textual environment because the textual environment might not offer enough background information to obtain accurate results when adopting this perspective.
In summary, each theory presents a different perspective which can guide but also has implications regarding the approach one can use to detect emotions in mediums such as text, audio, video, body or facial movements, etc.
References:
[1] C. Darwin, The expression of the emotions in man and animals, Vol. 526, (University of Chicago press, Chicago, US, 1965). (Originally published in 1872).
[2] W. James, “What is an emotion?,” Mind 9, 188–205 (1884).
[3] C. G. Lange, “The mechanism of the emotions,” in The Emotions,D. Dunlap, ed. (Williams & Wilkins, Baltimore, MD, USA, 1885), pp. 33–92.
[4] W. James, The Principles of psychology (Dover, New York, NY, 1890).[5] J. Walsh, “Theories of emotion,” (12/15/2013), Khan Academy, https://www.
khanacademy.org/video/theories-of-emotion (visited on 2017-03-12).
[6] W. Cannon, Bodily Changes in Pain, Hunger, Fear and Rage: An Account of Recent Researches Into the Function of Emotional Excitement (Appleton-Century, New York, NY, 1929).
[7] P. Bard, “On emotional expression after decortication with some remarks on certain theoretical views: Part I,” Psychological Review 41, 309–329 (1934).
[8] S. Schachter and J. Singer, “Cognitive, social, and physiological determinants of emotional state,” Psychological review 69, 379–399 (1962).
[9] R. R. Cornelius, “Theoretical approaches to emotion,” in Proceedings of the ISCA Workshop on Speech and Emotion (ISCA, 2000), pp. 3–10.
[10] M. B. Arnold, Emotion and personality (Columbia University Press, New York, NY, 1960).
[11] P. C. Ellsworth and K. R. Scherer, “Appraisal processes in emotion,” in Handbook of affective sciences, K. Scherer and H. Goldsmith, eds. (Erlbaum, Mahwah, NJ, 2003), pp. 572–595.
[12] J. Averill, “A Constructivist View of Emotion,” in In Emotion: Theory, Research and Experience, R. Plutchik and H. Kellerman, eds. (Academic Press, New York: NY, 1980), pp. 305–339.
[13] P. Ekman, W. V. Friesen, and P. Ellsworth, Emotion in the Human Face: Guidelines for Research and an Integration of Findings: Guidelines for Research and an Integration of Findings (Pergamon Press Inc., Elmsford, NY, 1972).
[14] R. R. Cornelius, The science of emotion: Research and tradition in the psychology of emotions (Prentice-Hall, Inc, Englewood Cliffs, NJ, 1996).
[15] N. H. Frijda, The emotions (Cambridge University Press, New York, NY, 1986).
[16] K. R. Scherer, “What are emotions? And how can they be measured?,” Social science information 44, 695–729 (2005).
[17] J. E. LeDoux, “Emotion, memory and the brain,” Scientific American 270, 50–57 (1994).
[18] K. R. Scherer, “Psychological models of emotion,” The neuropsychology of emotion 137, 137–162 (2000).
[19] R. A. Calvo and S. D’Mello, “Affect detection: An interdisciplinary review of models, methods, and their applications,” IEEE Transactions on affective computing 1, 18–37 (2010).
I distinctly remember last year when the Head of the Computer Science Department at the University of Helsinki gathered majority of the departmental staff to celebrate the department being ranked 1st in the Nordic region and coming 101-150 around the world – according to the QS World University Ranking. The University of Helsinki as a whole comes in at number 102 globally in the QS ranking and 90 in the Times Higher Education World University Rankings. While standing there, I naturally wondered which African universities and especially computer science departments appeared on this same list.
To answer my question, using the same QS ranking system (which judges institutions along the core missions of research, teaching, knowledge transfer, and international outlook), I visualized the top 5 universities and top 5 computer science departments across all the continents. In the analysis, I chose to separate the Middle Eastern countries for further comparison.
So what does the QS ranking list show?
3 of the top 5 universities on the African continent are in South Africa and the other two are in Egypt.
As can be seen in the map, the first African university to appear on the QS ranking is the University of Cape Town, in South Africa, coming in at no. 191.
Looking solely at the ranking of African universities, I found that the top 15 universities on the continent constitute:
7 universities in South Africa, 5 in Egypt, and 1 in Uganda, Ghana and Kenya respectively.
With the Times Higher Education ranking, Makerere University in Uganda, comes in fifth rather than 12 as ranked by the QS ranking [source].
In addition, I looked at the ranking of computer science departments around the world and found that:
Only 2 computer science departments in Africa appear in the rankings, one in South Africa and one in Egypt.
The QS ranking system uses six metrics to evaluate universities, namely: Academic reputation, employer reputation, faculty / student ratio, citations per faculty, international faculty ratio, and international student ratio [1]. Other ranking systems like the Times Higher Education and the Shanghai ranking use different metrics for their evaluation. In majority of these rankings, the top 10 spots are dominated by universities in the USA and UK, though in recent years, a few Asian universities, mostly South Korean have climbed up to be in the top 20.
When it comes to the ranking of universities, there are debates on whether these rankings say anything of the actual quality of the institutions. For instance, those universities that have sufficient resources can game the ranking system. I tend to agree with Ward [2] that these indicators and metrics “tend to greatly overvalue the ‘haves’ at the expense of the ‘have nots’.” Many of the metrics used emphasize strong research results and these results are strongly influenced by the amount of resources reserved for research and international cooperation by universities. Research is expensive, publishing in top journals is expensive, and resources (and a good reputation) are needed to attract international students and leading faculty – which rules out a lot of institutions in developing countries.
Recently, there has been talk of creating ranking systems exclusively focused on Africa, like The Times Higher Education African ranking that was piloted in July 2015. This ranking uses metrics that take into account the developing context of the continent. However, I don’t know if this captures quality either and I do not see how this will help the institutions compete with the rest of the world.
When it comes to ranking African universities, another issue pointed out by former UN secretary-general Kofi Annan at the African Higher Education Summit in Dakar in 2015, is that there is a chronic lack of data available about Africa’s universities – data is missing to accurately rank and compare universities [3]. This was also supported by the World bank and Elsevier report [4]. Missing data, of course can lead to miss-ranking of universities, which can affect resource allocation and the awarding of grants and projects. It has been reported that Africa accounts for 1% of world research outputs [4], but this number could, in reality, be higher. But it is probably not as high as it should be. Research breeds innovations, and for me, improving research (also linked to resources) is a key outcome that would make a difference. On top of that, there is also a need to strengthen the data collection for accurate reporting and decision making – both areas interest and motivate me greatly.
Sources:
[1] QS Top Universities (June 2017), QS World University Rankings Methodology, https://www.topuniversities.com/qs-world-university-rankings/methodology
[2] Steven C. Ward (October 2, 2014), What do world university rankings actually mean? The Conversation, https://theconversation.com/what-do-world-university-rankings-actually-mean-32355
[3] Damtew Teferra (September 3, 2015), Ranking African universities is a futile endeavour, The Conversation, https://theconversation.com/ranking-african-universities-is-a-futile-endeavour-46692
[4] Blom, A., Lan, G., & Adil, M. (2015). Sub-Saharan African science, technology, engineering, and mathematics research: a decade of development. World Bank Publications.
*The maps were created with R’s leaflet and map packages.
Continuing from my last post about the Oscars, in this one I look at this year’s Oscar nominations. In particular, I focus on the number of people of color that have been nominated in the “big” categories (i.e., Best actor / actress, best supporting actor / actress and best director). I analyze the changes in the context of my previous analysis where I looked at the diversity in the 2017 nominations compared to the 2016 and 2015 nominations. 2016 was the year when steps were publicly made to diversify and increase the number of Academy Award voters, especially in light of the #OscarSoWhite hashtag that trended after the 2015 and 2016 nomination announcement as well as the Oscar boycott in 2016.
Last year as well, new voters were ushered in, as a way to continue diversifying the voting committee (Read the full report on the Oscar class of 2017). So what did this change bring in terms of nominations for people of color? Based on the Oscar nominations that were released on the 23rd January, we can see that:
Total number of people of color nominated reduced from 7 to 5
In the 2017 nominations, we saw a big rise from zero people of color nominated in 2015 and 2016 to a total of 7 in the five big categories (i.e., Best actor / actress, best supporting actor / actress and best director). From the figure below we see that in 2018, this number decreased to 5 – which is still better than the 2015 and 2016 nominations. In addition, this year people of color are represented in the best actor, best director and best supporting actress categories.
A woman this year has been nominated in the Best Director category
In light of the women movement in Hollywood, I also looked at the gender distribution in in the best director category. Here, we see that in this year’s nominations, one woman was nominated. Although it is only just one, it is an improvement from 2015, 2016, and 2017 where zero women were nominated.
This year’s nominations thus showed a decrease but still a presence of people of color in the big actor categories. In addition, it showed an increase of one woman nominated in the best director category. As more changes and movements keep happening, I look forward to seeing how these impact the diversity in nominations and opportunities in Hollywood.
The following movie analysis post was driven out of curiosity. I distinctly remember that when I was watching the movie Joy starring Jennifer Lawrence, and Bradley Cooper’s character appeared, I wondered about the exact number of times that these two actors have actually appeared together. I know they were together in Silver Linings Playbook, Serena, as well as American Hustle. While pondering about that, I continued to wonder which other actors in Hollywood have often appeared together and exactly how often. So this year, I finally got around to doing the analysis and satisfy my curiosity. This post shares some of the analysis results. The analysis code and data are available on github.
Data collection
As the number of movies is enormous and I did not want to go through every movie that has ever been made in Hollywood, I restricted the analysis to only movies that have received an Oscar nomination in the predominant categories of Best and Supporting Actor and Actress and Best Director and Producer, from the time the Oscars have been awarded, i.e., 1928 to 2017. Of course this restriction removes certain actors that I know appear frequently together like Adam Sandler with David Spade, Rob Schneider or Luke Wilson, or Vince Vaughn, with Ben Stiller and Will Ferrell, whose movies are usually not nominated for Oscars.
So first a list of the Oscar nominated movie titles in each of the 6 categories (i.e., Best Actor / Actress, best supporting actor / actress, best producer, best director ) was automatically collected from Wikipedia into a csv file along with the year of nomination. In total, I had 1,266 movies in the dataset (Data available here).
Then, with that movie title and year, I wrote a R script to search Google and extract the IMDb URL of the movie, with the aim of getting the IMDb ID of each movie.
Next, with the URL and another R script, I extracted the ID and searched the IMDb page of the movie to get the full cast of the movie.
Lastly, With the full cast data set, I was thus able to explore the data and answer my curiosities. This is what I found out:
Results
Meryl Streep has appeared 23 times in Oscar nominated movies
In total, 15,689 actors have appeared in these movies. From the analysis, I found that Meryl Streep is at the top of the list with the highest number of appearances in Oscar nominated movies, with 23 appearances. Of these 23, she has won an Oscar on 3 occasions, for the movies Kramer vs. Kramer (1979), Sophie’s Choice (1982), and The Iron Lady (2011).
Bette Davis (deceased) comes in second with 19 appearances. I also noticed that some of my favorite actors such as Robert Duvall, Jack Nicholson, Jeff Bridges, Robert De Niro, Ed Harris, Tom Hanks, Cate Blanchett, and Leonardo DiCaprio are high on this list.
In addition,
Meryl Streep has also the highest appearance with other actors
Not surprising, Meryl Streep has acted with a lot of actors. The analysis shows in total that she has acted with 437 other actors.
Among those actors that Streep has appeared the most with in the Oscar nominated movies, Margo Martindale appears to be at the top. They appeared together in the movies Marvin’s Room (1996), The Hours (2002), and August: Osage County (2013).
Although Streep has the most appearances, she is not the one leading the list of those who have worked with the same actor the most. There are a total of 23 actors such as Anna Q. Nilsson (deceased), Beah Richards (deceased), Eric Phlmann (deceased)– who have acted with one actor 5 times, 5 being the highest. As a possible explanation, these actors were in movies in the early part of the 20th century – where the number of actors and actress was not as large as it is currently. Thus of those 23 actors, only two are still alive, Hal Holbrook and Jane Alexander.
Bradley Cooper has worked the most with Jennifer Lawrence in Oscar nominated movies.
With my original curiosity, I got to confirm that in total Cooper and Lawrence have appeared together 3 times in Oscar nominated movies.
As a side note, Cooper did not win an Oscar in any of those three movies, Lawrence however did win for Silver Linings Playbook.
So that’s it, my curiosity for now is satisfied. All code and datasets are publicly available here. If you notice something that I did wrong there or reported here, please drop me a line. Otherwise, if time allows, I might extend this analysis to also include directors. I know for instance Leonardo DiCaprio has collaborated often with Martin Scorsese“, as well as Tom Hanks with Steven Spielberg and Robert Zemeckis, and there might be other co-appearances with directors that might be interesting for some future post.
Ever since a friend recommended the Black Mirror anthology series some years back, I have been a fan. So when Season 4 came out on December 29, my New Year’s holiday day was spent binge watching the whole season – I couldn’t help myself!
Although this was not the best season, many of the episodes were very intriguing to watch. [Spoilers ahead]. After finishing all the 6 episodes, I observed a sort of common theme around the technology, i.e., technology allowing for full immersion to the point of transferring consciousness and or allowing for shared experiences – with the exception of the Metalhead episode (Ep. 5) which really did not provide much background information. We observe for instance, that the technology in episode 1: USS Callister gives the lead actor the ability to fully immerse himself in a digital environment that his consciousness could even be trapped in it, and in episode 3: Crocodile, we see a device that makes sharing of memories possible.
Furthermore, the Season 4 stories particularly show us how seemingly simple technological decisions can go humanly wrong. This is more apparent in episodes 2 and 6.
In episode 2: Arkangel – we observe a child getting lost and the mother naturally getting very worried for the child’s safety. With her love and concern for the child, the mother makes the decision to get a rather advanced tracker implanted into the child. A device I can see many mothers seriously considering. Beyond what current trackers are capable of, i.e., knowing where someone is, this tracker can track body vitals and conditions, see what the child is seeing, with the option of even filtering out what the child is seeing, among other capabilities. But we soon see how such capabilities, i.e., constantly knowing what your child is looking at, having the power to filter and even know body conditions before the child does, goes wrong for both the mother and daughter. We see the daughter want to experiment with things, start to need her privacy as well as lie as teenagers would do, and we see the mother struggle with the need to know, control and filter the daughter. In a way, I actually think the mother became addicted to the device and the constant need of knowing what was the child was doing.
Addictions and sharing of experiences were also some of the topics that were touched on in the three stories told in episode 6: Black Museum. There is the doctor who is able to share the pain of his patients. Although at first he is able to help his patients through this shared experience, we soon see him become addicted to the pain and fear, that he eventually commits murder to get his fix. Then, we also see the ability to transfer consciousness in two of the stories. There is the story with the comatose wife and the other with the death-row in mate whose consciousness gets transferred into a hologram.
In the story of the comatose wife, we can perhaps all understand why the husband and wife would make the decision to have the wife’s consciousness transferred in the husband. Who would not give their loved one the chance to talk, see and hug their child if they could? But having someone constantly commenting and criticizing what you look at, what you do, how your body reacts – all this on top of your own critical voice is a recipe for disaster, and we see in this story how it all goes wrong.
In addition to the above stories of season 4, there are notably other Black Mirror seasons that show us how the technology they present does go wrong, e.g., season 1, episode 3. That is one of the things I like about Black Mirror, that it always reminds us that as technology advances and permeates many aspects of our lives, as we immerse ourselves in it and it allows us to have shared experiences – there are several ways in which these technological advancements can go humanly wrong.
I believe good motivational and encouraging words are always needed – to give us that extra push when and if we need it. Thus my first post in 2018 is going to be just about that – some motivational and encouraging words for the year ahead.
The motivational words are not mine but I like them a lot (had posted it here as well). They are from a montage motivational video, called Sacrifice by Les Brown, Eric Thomas and Ray Lewis. I find the words inspirational, and as the video itself does not have subtitles, I have included the words below just in case you are like me and like to have motivational words posted on the wall, work desk or laptop so that you can reflect and visualize them often.
Ever since Shark Tank aired in 2009, I have been a fan of the show – from the varied business ideas that get pitched, the background stories of the presenters, to the deals that get made or not made. After several seasons of watching the show, I became curious about certain statistics such as the actual number of females vs males that come to pitch, how many people of color pitch and get deals, what industries gets the most deals, how many of those that got deals shed some tears, etc.
I was thus glad to find a full Shark Tank dataset being kept and maintained by angel investor, Halle Tecco – bit.ly/STankData. With the dataset, I was thus able to explore some of my curiosities. As there are many, I will explore them over two posts. With the first post, I will look at gender distribution, focusing on the eight seasons that are complete. Season 9 is currently ongoing and the analysis below will be updated to reflect that once its completed.
The number crunching was done using R programming, and I have made the R script available on github.
So what did the analysis reveal?
As expected, men constitute the biggest proportion of the presenters:
Looking at all the eight complete seasons, a total of 707 ideas and businesses have been pitched. Of those, 422 were made by Males, 177 by Females, and 108 by a Mixed team.
This trend is apparent from season to season, where we also observe that the show has been having a higher number of seasons since the first three seasons. More specifically, season 2 had the lowest with 36 presenters, while seasons 5, 6, and 7 had the highest with all a total number of 116 presenters each.
Naturally, with the higher proportion of Males in the show, majority of the deals also go to men:
As shown in the figure above, the highest number of females to receive deals were observed in seasons 1 and 2, with 37%. Mixed teams were highest in season 5, at 23% of the total presenters.
Looking at those who got deals, on a good note, more women who pitch get the deal in comparison to males:
Considering just gender specific categories, the data reveals that:
– Out of 177 females that pitched, 99 got the deal (56%)
– Of the the 422 males that pitched, 211 got the deal (50%)
– Similarly to females, 56% of the mixed teams that pitch get a deal (61 out of 108).
The ‘Food and Beverage’ industry has the highest number of presenters:
There are several Industries that are represented on the show and I am always interested to see if there are gender differences in the fields that men and women pitch in. Overall, among the 707 presentations, ‘Food and Beverage’ and ‘Fashion and Beauty’ had the highest representation with 20.8% and 19,8% respectively. The lowest fields represented were ‘Automotive’, ‘Green and CleanTech’, ‘Travel’, and ‘Business and Services’ with 0,99%, 1,41%, 1,41%, and 1,84% respectively.
Notably, Men tend to pitch in ‘Food and Beverage’ and ‘Lifestyle and Home’ industries, while Women are more in ‘Fashion and Beauty’ and ‘Food and Beverage’:
Results reveal that 19,4% (82 of 422) and 16,4% (69 of 422) of males pitched in the ‘Food and Beverage’ and ‘Lifestyle and Home’ industries. While 31,6% (56 of 177) and 22% (39 of 177) females in ‘Fashion and Beauty’ and ‘Food and Beverage’ industries respectively. Similarly, mixed teams were mostly in 24,1% (26 of 108) ‘Food and Beverage’ and 19,4% (21 out of 108) in ‘Fashion and Beauty’.
Notably, no females are recorded to have pitched in the Green and Clean Tech and Automotive fields.
As I work in Tech and constantly hear and observe the low female representation in Tech fields and startups, I was interested to see how this fact is reflected in the Shark Tank data. The data revealed first that the ‘Software and Tech’ industry is fifth in the list of the most presented in industry for men and 8th for women. For some reason, I thought the industry would be higher on the list.
Moreover, of the total females that pitch, 3,39% pitch in the ‘Software and Tech’ industry, while 9,24% of the males pitch in that industry. Roughly half of those who pitched in the Tech field got deals irrespective of gender.
******** That’s it for Part I ********
The above results will be updated to also reflect incoming data for Season 9.
Stay tuned for Part II, where I will explore other factors such as how many people of color have pitched and got deals from season to season.
With all the hype around chatbots, I was glad to get a chance to actually get some experience in developing one. A few weeks ago, within our Immerstive Automation project, we had Nick Diakopoulos, an Associate Professor in computational and data journalism, lead a workshop on creating chatbots. I was very excited to get to build my first chatbot.
During the workshop, we were introduced to one tool, Chatfuel, for developing Facebook messenger chatbots. It is used by many companies and newsrooms (shown here https://chatfuel.com/bots/) and is easy to use for beginners. Examples of chatbots include those that give you weather updates when you ask, ones that help you pick out and order groceries for the week or news bots that alert you when something interesting happens. For many of these companies, chatbots provide several advantages, as they are able to handle tasks automatically, thus reducing manual hours.
In the workshop, we were teamed up in groups of three. In my group we ended up creating a chatbot that serves you a poem when you ask from it. Nothing fancy as we just implemented a few conversational rules and we didn’t publicly release it. Future plans include experimenting with something more advanced using machine learning, as Chatfuel is rule-based and has limitations in conversational depth.
When designing chatbots, however, here are a few guidelines we were given in the workshop that can guide you on creating a chatbot:
1) Select a specific problem or opportunity that you want to address.
2) Define audience and goal(s) of audience interacting with bot. What will the bot do? Does it solve a problem? Who will use it? Does it serve a particular demographic or niche? In what context will the audience use it?
3) Create a persona for your bot: what are the bot’s goals and behaviors? Will it have a name or personality? What kind of tone will it take?
4) Define the interaction: How will your bot interact? Can you describe a scenario that walks though those interactions step by step? – Good practice here is to try and improvise the conversation: Act out the conversation.
5) Check if there is any data or knowledge-base that your bot needs in order to work?
Lastly, always have a fall back, a user friendly way for your bot to react when it does not ‘understand’ user input.
That’s it! Feel free to share any interesting chatbots that you have created or your favorite tools and approaches, etc.
In academia, they say that you either publish or perish, thus it was good news to know that this year, I was not going to be falling under the latter. In June and July, I received news of six publications that were accepted, putting me in an even better mood before going for summer holidays.
Below is a summary of the papers and their highlights.
Natural language generation
Data-driven news generation for automated journalism: Leppänen, L., Munezero, M., Granroth-Wilding, M. and Toivonen, H., The 10th International Conference on Natural Language Generation (INLG). Santiago de Compostela, Spain, September 2017. To appear.
Highlights: In this paper, we explore the field and challenges associated with building a journalistic natural language generation system. We present a set of requirements that should guide system design, including transparency, accuracy, modifiability and transferability. Guided by the requirements, we present a data-driven architecture for automated journalism that is largely domain and language independent. We illustrate its practical application in the production of news articles upon a user request about the 2017 Finnish municipal elections in three languages, demonstrating the successfulness of the data-driven, modular approach of the design.
Finding and expressing news from structured data: Leppänen, L., Munezero, M., Sirén-Heikel, S., Granroth-Wilding, M. and Toivonen, H., 21st International Academic Mindtrek Conference. Tampere, Finland, September 2017. To appear.
Highlights: This work proposes approaches for automatically finding news or newsworthy events from structured data using statistical analysis and for providing added value to audiences. Utilizing a real natural language news generation system as a case study, we demonstrate the feasibility and benefits of automating those processes. In particular, the paper reveals that through automation of the news generation process, a large amount of news can be expressed in digestible formats to audiences, at varying local levels, and in multiple languages. In addition, automation makes it easier to provide interactivity to the audience allowing them to tailor or personalize the news they want to read.
Open source community analysis
An exploratory analysis of a hybrid OSS company’s forum in search of sales leads: Munezero, M., Kojo, T. and Männistö, T., In Empirical Software Engineering and Measurement (ESEM), 2017 ACM/IEEE International Symposium on. IEEE, Toronto, Canada, November 2017 – To appear
Highlight: The paper presents ongoing work utilizing text analysis techniques to analyze the content of forum posts of a hybrid open source company that offers both free and commercial licenses, in order to help its community manager gain improved understanding of the forum discussions, sentiments, and automatically discover new opportunities such as sales leads.
The many hats and the broken binoculars: State of the practice in developer community management: Mäenpää, H., Munezero, M., Fagerholm, F. and Mikkonen, T., The 13th International Symposium on Open Collaboration (OpenSym), Galway City, Ireland, August 2017 – To appear
Highlight: The paper investigates the varied tasks that community managers perform to ensure the health and vitality of their communities. We describe the challenges managers face while directing the community and seeking support for their work from the analysis tools provided by state-of-the-art software platforms. Our results describe seven roles that community managers may play, highlighting the versatile and people-centric nature of the community manager’s work.
Continuous experimentation
Introducing Continuous Experimentation in Large Software-Intensive Product and Service Organizations: Yaman, S.G., Munezero, M., Münch, J., Fagerholm, F., Syd, O., Aaltola, M., Palmu, C. and Männistö, T., Journal of Systems and Software, 2017 – In Press
Highlights: This article presents a multiple-case study that aims at better understanding the process of introducing continuous experimentation into an organization with an already established development process. Our findings indicate that organizational factors may limit the benefits of experimentation. Moreover, introducing continuous experimentation requires fundamental changes in how companies operate, and a systematic introduction process can increase the chances of a successful start.
Notifying and involving users in experimentation: Ethical perceptions of software practitioners: Yaman, S.G., Fagerholm, F., Munezero, M., Mäenpää, H. and Männistö, T., In Empirical Software Engineering and Measurement (ESEM), 2017 ACM/IEEE International Symposium on. IEEE, Toronto, Canada, November 2017 – To appear
Highlights: This paper examines how ethical issues involved in experimentation are currently understood by practitioners in software development. We conducted a survey within four software companies, inviting employees in different functional roles to indicate their attitudes and perceptions through a number of ethical statements. We observed that employees working in different roles have different viewpoints on ethical issues. While managers are more conscious about company-customer relationships, UX designers appear more familiar with involving users, and developers think that details of experiments can be withheld from users if the results depend on it.
During the Tech Research Showcase I attended a few weeks ago, someone asked me to guide them to some materials to start learning and doing some natural language processing and text analysis as a beginner. Text analysis, text mining, and natural language processing (NLP) are fields that all deal with mining and analyzing textual data to discover interesting patterns, extract useful insights, or learn more about the structure of language. Sometimes the terms are used interchangeably, even though the fields have different goals and work at different levels of language analysis. In addition, they all include techniques from linguistics, mathematics, statistics, and computer science.
In this post, I will not go into introducing the fields as they has been covered in several resources, and frankly, they are too huge to cover well in one post. They include a vast amount of techniques and methods for performing language detection, translation, document summarization, sentiment analysis, part-of-speech tagging, topic modeling, question answering, etc. A good background book which is practically oriented is the Practical Text Mining and Statistical Analysis for Non-structured Text Data Applications.
As large fields that have gained increased interest in both Academia and Industry, there are several sources and ways one can start. However, for someone who wants to just get their feet wet with text analysis, I would recommend the following links and courses to get practically started. From these, you also get to understand what is involved and helps you identify what questions or what insights you might want to get from the analysis or mining of the text, e.g., what is the sentiment in the text? What is the genre? Is it spam? among many others.
Recommendations:
-Natural Language Processing with Python: Analyzing Text with the Natural Language Toolkit – a practical introduction to NLP. You will learn by example, write real programs, and grasp the value of being able to test an idea through implementation.
–Python for text analysis – A practical course in Python, geared towards those who want to get some hands-on experience working with language data.
–Text Mining and Analytics – The course will cover the major techniques for mining and analyzing text data to discover interesting patterns, extract useful knowledge, and support decision making, with an emphasis on statistical approaches that can be generally applied to arbitrary text data in any natural language with no or minimum human effort.
Besides understanding the field itself, recently it has become important to also understand how machine learning models are powering NLP applications. Recently, deep learning approaches have obtained very high performance across many different NLP tasks.
I will continue updating this page as I come across better or additional materials. If you have other good suggestions for beginners, please feel free to share.
Last week, I took part in my first Tech Research Showcase. As a researcher who is interested in entrepreneurship I wondered afterwards why I had never attended a pitching event where the sole focus was my research. The tech research showcase event was organised by Icebreaker.vc at the startup hub Maria 01.
Icebreaker invited tech researchers from around Finland to come and give a five minute pitch on their research to an audience of business people, developers and designers. The event was motivated by the world-class research conducted in Finland and by the several companies that have started as a result of it, for example, Relex, Beddit, and Callstats.io.
I was attracted to the event, first because one could pitch their research even if you were at the state where no commercialization value had been identified – the aim of the event was to put researchers in a room with experienced people that have the ability to collaborate, point you in the right direction or give some business advice. And since commercialization is something that has come up in my current work project Immersive Automation, I wanted to gauge the interest and potential of our research. Secondly, I was challenged by presenting my research in five minutes. Normally, I have done research presentations in conferences, seminars, lectures, etc., events where I have anywhere between 20 to 1 hour, significantly more time. But 5 minutes, in front of people who might not know the field was a challenge that I wanted to undertake.
For the pitch itself, we as the presenters were advised by the organizers to follow a format where we presented the following:
The problem that is being solved – put in a way that it could be understood by a non-expert.
How the problem is solved today. What is the state-of-the-art?
What it is you have discovered in your research. What is the new idea?
What the results are using your method compared to the best solution today.
What you are looking for. For example, particular skills, co-founders, or guidance. This should be as concrete as possible.
In total we were 12 researchers pitching, with majority of the presenters being from Aalto University and University of Helsinki. Machine learning, as might be expected was the dominating theme among the presentations and the presentations ranged from ideas to already launched startups.
Having participated in a few business pitching events, one advice I could give to fellow researchers, myself included, would be to participate in more training on selling ones research work and ideas. A few presentations went into too much detail about the technicalities of the research such that it was difficult for some of the audience members to fully grasp the potential of the idea. A good training course that is focused on how to sell research work and ideas is the one provided by the brothers Andy and Steve Langdon. The two-day course is practically oriented, one learns a lot of selling techniques, and its organised in a fun and relaxed way.
Actually, I think many universities should internally organize events like these as a way for researchers to learn and practice selling their work, a skill I believe is needed in today’s competitive world. I found having to think and prepare a five minute pitch interesting and it does make you look at your research from various other angles besides research publications.
Continuous experimentation as a development and decision-making approach has always been one that I found not only to apply to software or businesses development. It could actually also be applied to personal development. Just like in business and product or service development, experimentation, through small, fast, and cheap probes, can allow us to gain deeper insight of what we really want, what makes us happy or what works for us in terms of achieving our goals.
As the cookbook lays out, to conduct successful experiments, a few key elements should be understood (captured in Figure 1). Although these elements are specific to software development in the book, I will use a personal development example to illustrate how this approach might be applicable (see Table 1).
Figure 1: The continuous experimentation cycle that links decision-making to systematic experimentation (Adapted from [1]).
Table 1: Key elements in continuous experimentation applied to a personal development example (Example narrative is in Orange color).
Notably, not all the experimentation elements that are presented in the cookbook or in Table 1 will be necessary for every personal development experiment. In addition, I think that for personal development experiments, there is more flexibility on how scientific they should be. For instance, in experimentation, one must introduce the change and then hold everything else constant to observe cause and effect, but in life it is hard to hold things constant and this might interfere with the results. But I believe a clear hypothesis and good execution plan can mitigate those factors, and can help you make informed decisions where you need them or just want to be certain.
To conclude, continuous experimentation, just as with software or business development, can also work for our personal development, by helping us test our assumptions about what we want or think is true about ourselves, and then help us make informed decisions and changes. Of course this approach is one of many other approaches to decision-making. As highlighted in the cookbook, one of the pitfalls to avoid is making decisions solely from the collected data. As humans, we still have our intuition and experiences to guide the decision making process (see discussion of this in a previous post). But of course decision-making is guided by having access to factual information.
Would definitely love to hear your experiences on how or where you would apply this approach to your personal development.
Source:
[1] Munezero, M., Yaman G. S., Fagerholm F., Kettunen, P., Mäenpää H., et al.: Continuous Experimentation Cookbook: An Introduction to Systematic Experimentation for Software-intensive Businesses,DIMECC Publications Series No.15, Helsinki, Finland, 2017.
Over the past few years, companies like Google, Twitter, or Facebook have had to walk a fine line between policing negative behaviors such as hate speech, terrorism, fake news, etc., and supporting basic rights of free speech online. With the increase in aggressive, terrorism, cyberbullying, hate speech, and racist communication, as well as expressions of depression or suicidal thoughts on social media, there are however increased pressures and incentives on these organizations and researchers (like myself) to develop fully or semi-automated methods to detect these negative behaviors. However, as pointed out in my dissertation, balancing the prevention of these harmful behaviors with privacy and ethical rights is a challenge, but this conversation is something that should be had.
In my PhD research, for instance, I aimed at building antisocial behavior detection models that could be incorporated into real-world systems and act as early warning systems for security enforcement organizations or institutions like schools. Although the research respected privacy rights, with these types of detection there is always the concern over the access and analysis of personal information, with concerns that it might be just be a step away from ‘big brother’.
Facebook, with its almost two billion users and use of sophisticated algorithms, privacy and ethical rights are always a question mark. This year, for example, it introduced a semi-automated depression detection algorithm that analyzes and spot patterns of posts that are potential suicidal, and then sends them to the Facebook team for appropriate response [1, 2]. Earlier, this identification process used to be only manual.
It is true that a lot of data is public or that users on certain platforms give away the rights to their data. This makes it easier to develop these detection algorithms, however, it might not be the wish of a Facebook or twitter user to have their data analyzed for purposes that they have not given their consent to. This was for instance observed when it was reported in June 2014 [3] that Facebook was using status updates to manipulate users’ moods and observe how that manipulation translated to their status updates. Even though with Facebook one does agree to their data policy when using their application, people however are often not aware of what is being done with their data and it is hard to draw the line of whether it is alright or if it is infringing on privacy rights. Though, an argument could be made that we must just accept that anything that is posted on social media platforms is not private.
Ethical and privacy issues do arouse real concerns that have an impact on the broad areas of developing and using detection algorithms to detect harmful behaviors. If data is public or accessible, should researchers or organizations still ask for consent to use the data for research or development purposes? If yes, to whom should the consent be acquired from? With so much available data, it is the task of researchers and practitioners to make sure that the data acquired is only used for good. But how do we measure what is good and what might be considered invasive or infringement of free speech? It might be argued that if data and technology are used to prevent crimes or improve quality of life, then it should be allowed. However, under those reasons, organizations can have the excuse or reason to automatically monitor and prevent the posting or sharing of messages that are deemed harmful from their perspective. With such policing, one might wonder if uprisings like those in Egypt in 2011 which made use of social media to organize, schedule, and spread the uprisings would have been possible [4, 5].
It is hard to see what a good solution to this would be, but perhaps to take advice from Ray Kurzweil [6], maybe the answer to these ethical and privacy concerns is to have a set of standards that are established through a whole social discussion between technologists and society, within and across different societies.
References:
[1] Matt Burgess, (6 March 2017), How tech giants are using AI to prevent self-harm and suicide, Wired, http://www.wired.co.uk/article/facebook-safety-self-harm-suicide-ai-instagram, (visited on 2017-04-27).
[1] Natt Garun, (1 March 2017), Facebook leverages artificial intelligence for suicide prevention, The Verge, http://www.theverge.com/2017/3/1/14779120/facebook-suicide-prevention-tool-artificial-intelligence-live-messenger, (visited on 2017-04-27).
[3] Kashmir Hill (28 June 2014), Facebook manipulated 689, 003 users’ emotions for science, Forbes, https://www.forbes.com/sites/kashmirhill/2014/06/28/facebook-manipulated-689003-users-emotions-for-science/#4736d97197c5, (visited on 2017-04-27).
[4] Erick Schonfeld, (16 February 2011), The Egyptian behind #Jan25: “Twitter is a very important tool for protesters”, TechCruch, https://techcrunch.com/2011/02/16/jan25-twitter-egypt/ (visited on 2017-04-29)
[5] Sam Gustin, (11 February 2011), Social media sparked, accelerated Egypt’s revolutionary fire, Wired, https://www.wired.com/2011/02/egypts-revolutionary-fire/ (visited on 2017-04-29)
[6] Bill Joy and Ray Kurzweil, (12 July 2001), Future shock: High technology and the human aspect, Hoover Institution, http://www.hoover.org/research/future-shock-high-technology-and-human-prospect (visited on 2017-04-27).
The words we use and our writing styles can reveal information about our preferences, thoughts, emotions and intentions. Using this information, I developed machine learning models that can detect antisocial behaviors, such as hate speech and indications of violence, from texts, as part of my recently defended PhD dissertation, titled “Leveraging emotion and word based features for antisocial behavior detection in user-generated content.”
Historically, most attempts to address antisocial behavior have been done from educational, social and psychological points of view. My PhD research, however, demonstrated the potential of using natural language processing techniques to develop state-of-the-art solutions to detect antisocial behavior in written communication.
The research created solutions that can be integrated in web forums or social media websites to automatically or semi-automatically detect potential incidences of antisocial behavior with high accuracy, allowing for fast and reliable warnings and interventions to be made before the possible acts of violence are committed.
One of the great challenges in detecting antisocial behavior is first defining what precisely counts as antisocial behavior and then determining how to detect such phenomena. Thus, using an exploratory and interdisciplinary approach, I applied natural language processing techniques to identify, extract, and utilize the linguistic features, including emotional features, pertaining to antisocial behavior.
The research investigated emotions and their role or presence in antisocial behavior. Literature in the fields of psychology and cognitive science shows that emotions have a direct or indirect role in instigating antisocial behavior. Thus, for the analysis of emotions in written language, the research created a novel resource for analyzing emotions. This resource further contributes to sub-fields of natural language processing, such as emotion and sentiment analysis.
Because a problem in researching antisocial behavior in written language was that there was no adequate collection of texts, the research, in addition, created a novel corpus of antisocial behavior texts. The corpus allowed and will continue to allow for gaining deeper insight and understanding of how antisocial behavior is expressed in written language.
The study showed that natural language processing techniques can help detect antisocial behavior, which is a step towards its prevention in society. With continued research on the relationships between natural language and societal concerns and with a multidisciplinary effort in building automated means to assess the probability of harmful behavior, much progress can be made.
Doctoral dissertation is available for download at: http://epublications.uef.fi/pub/urn_isbn_978-952-61-2464-3/index_en.html
In the press:
Hilary Lamb (13th April 2017), Computers taught to recognise hate speech and violent language, Engineering and Technology, https://eandt.theiet.org/content/articles/2017/04/computers-taught-to-recognise-hate-speech-and-violent-language/
University of Eastern Finland (12 April 2017), New machine learning models can detect hate speech, violence from texts, ScienceDaily, www.sciencedaily.com/releases/2017/04/170412091222.htm
Terhi Nevalainen, (11th April 2017), Tietokone voi tunnistaa terroristin, Karjalainen, http://www.karjalainen.fi/uutiset/uutis-alueet/kotimaa/item/138639-tietokone-voi-tunnistaa-terroristin
Moving from Trump speech analysis (see previous post) to speech generation, in this post I investigate the possibilities of automatically generating text that could plausibly have been by Trump. For the generation, I experimented with using Markov chains. Markov chains, named after Andrey Markov, are stateless mathematical models that describe sequences of possible events. They are used in several real world applications such as autocomplete suggestions, speech recognition, text identifiers, path recognition, and in many other artificial intelligence tools.
A Markov chain tells the probability of transitioning from one state to any other state. In text generation, Markov chains learn the probability of the next word or character given one, two, or more words or characters. In this post, I will not delve into the details and mathematical formulation of Markov chains. For a visual description of how Markov chains work, see Victor Power’s site.
As this was my first practical experiment working with Markov chains, I thus began by using python code written by Nevo [1], which I then slightly modified for the purpose of generating Trump like speeches.
I started by creating a collection of Trump’s speeches. The collection included words from his inauguration speech and his first and final presidential debates. In total, the text collection consisted of 16,667 words. I first trained a Markov chain model on uni-grams (one word), then bigrams (two words) and trigrams (three words) and continuously increased the n-gram order. Then the model was given a random word or words to begin from, and it started generating the rest. I limited the length of generated text to 150 words.
Below are the results. What do you think, do the following texts sound like a speech made by Trump?
A: Text generated from model learned with unigrams
“I am a brilliant community, you tried to happen. And what do not show that. It’s an airplane on to that. I mean, I told them $1,500, and peaceful transfer of state when you right around election time, including a small group came out about young and that’s true throughout the true way you find this? Is it was so bad. First of our country. And I am going to Aleppo? OK, so many different reality exists: mothers and I should have taken the war in every year. You haven’t even worse, and I can’t do damage to be obsolete, because of the likes of them to have led our country, whether a routine audit. And I’ll go forward to myself, “I can’t bring into the clips where so much tougher and look — now, and other country, you would be a disaster.”
B: Text generated from model learned with bigrams
“We share one heart, one home, and one glorious destiny. The oath of allegiance to the manufacturing industry. You go to Mexico and other countries, while allowing for the presidency of the people she wants to make America great again. Thank you. Today’s ceremony, however, has very special meaning because today, we are not keeping up with the nations of the greatest assets anywhere in the world, beyond the United States got along well, that would help you, I would like to… It’s not an accurate one at all. It’s not an accurate one at all. It’s not nice. And I think I’ve ever seen in any government whatsoever. Wrong. CLINTON: … it is… Lester, how much? Typical politician. All talk, no action. Sounds good, doesn’t work. Never going to create new deals.”
C: Text generated from model learned with trigrams
“We, the citizens of America, are now joined in a great national effort to rebuild our country and our economy generally is — look, we owe $20 trillion. We cannot do it any longer, Lester. HOLT: Back to the question, though. How do you bring back — specifically bring back jobs, American manufacturers? How do you miss $6 billion? You ran the State Department, $6 billion was missing. How do you bring back — specifically bring back jobs, American manufacturers? How do you miss $6 billion? You ran the State Department, $6 billion was missing. How do you make them bring the jobs back? Well, the first thing you do is don’t let the jobs leave. The companies are leaving. I could name, I mean, there are thousands of them. They’re leaving, and they’re leaving in bigger numbers than ever.”
As can be seen, the text generated by the model trained with unigrams (A) is nonsensical. With the bigrams trained model (B), the text starts getting a bit better, but still does not make much sense. With the trigrams trained model (C), the text begins to sound like some thing Trump would say.
From my experiments, trigrams were identified as the highest possible order before the generated text resulted in direct quotations of the text used in the training and thus the models were no longer generating text per se. I also tried generating longer texts of more than 150 words, but it resulted in nonsensical texts. This is because the Markov chain models do no have a memory beyond the set n-grams. Thus, new sentences might be generated with topics that are not related to prior sentences.
Based on this experiment, I would say that Markov chains are not the best approach in generating speeches of considerable length, and future experiments involve identifying better approaches. For short texts, like Tweets, I have observed good results being achieved by recurrent neural networks. As an example, a Trump Twitterbot @DeepDrumpf produces quiet Donald Trump sounding tweets, for instance the following tweet “America has never been more harmed by the vote. I made a lot of money on that. I am doing big jobs in places, now everything is Benghazi.” Thus, a most likely next experiment will be to experiment with recurrent neural networks for generating longer texts.
Source:
[1] Omer Nevo (2016). Poetry in Python: Using Markov Chains to generate texts. https://www.youtube.com/watch?v=-51qWZdA8zM
By now, many of us have heard President Donald Trump speeches, or at least snippets of them. One thing I have noticed, among many other things, is that he tends to use a lot adjectives and adverbs or at least I always get the notion that they are many. Most likely, it could be just that it’s the same short adjectives and adverbs that are repeated over and over and thus sounds like he uses them a lot, for example in the following phrases; “…build a very huge wall”; “It’s going to be really great“; “sosad, tremendously sad, greatest sadness ever.”
Since the overuse of adjectives and adverbs can be seen as embellishing and can clutter sentences pointlessly, especially in formal speeches, I was curious about how Trump actually uses adjectives and adverbs in comparison to for instance the former president Obama, whose speeches have been said to be more eloquent.
To investigate, I compared transcripts of the inauguration speeches by Trump (2017) and by Obama (2009, 2013), and their first news press conference as president elect (Trump in 2017 and Obama in 2008). The press conference speeches included the president elects’ answers to posed questions by reporters. Table below summarizes the number of words in each speech. From the table, we can observe that there was a greater range in the number of words used by Trump in his first news press conference and inauguration speech, while Obama’s three speeches are relatively about the same in the number of words.
Table: Total number of words in presidential inauguration speeches.
For the analysis of the adjectives and adverbs, I made use of TreeTagger. TreeTagger is a tool for annotating text with part-of-speech tags. Part-of-speech (POS) tagging is the process of marking up words in a text with their part of speech, e.g., noun, verb, adjective, adverb, etc. After performing the part-of-speech tagging, I retrieved for each speech, only the word-POS pairs, where the POS tag was an adjective or adverb. From the retrieved list, I performed a comparative analysis of the usage of the adjectives and adverbs between Trump and Obama in their inauguration speeches (A) and in their first news press conference as president elect (B).
A. Inauguration speeches
The figures below show the distribution of adjectives and adverbs in each inauguration speech, as a percentage of the total words in the speech. From the figures, we can see that there is a higher use of adjectives and adverbs in Trump’s inauguration speech than in both Obama’s 09 and 13 speeches. Interestingly from the figures, we can see that Obama’s use of adjectives and adverbs has relatively been the same across both of his speeches.
From the results alone, it is difficult to judge whether they indicate an under, normal or over-usage of adjectives and adverbs. Thus, to get some indication, I included in the figures a LIWC mean score for both the adjectives and adverbs. The LIWC mean score was obtained from the popular Linguistic Inquirer Word Count (LIWC) text analysis tool. The tool includes a dictionary of words built from analyzing over 100,00 files of text , representing over 250 million words. In building the dictionary, it was identified that on average, adjectives constituted 4.49% of the total words and adverbs 5.27%. Thus, from the figures we can observe that while both Trump and Obama used significantly a higher number of adjectives than the LIWC mean, with adverbs, Obama is around the average, while Trump is visibly above.
Unfortunately, since majority of the text files used in developing the LIWC tool were not political type of speeches, a bigger comparison with other speeches to identify what is ‘average’ in the political context and where Trump’s speeches fall, would need to be conducted.
Exactly which adjectives and adverbs does Trump uses, was the focus of my next analysis. Figure below reveals the top 20 adjectives and adverbs that were most frequently us by Trump in his inauguration speech. Using those same 20 words, I identified how frequently they appeared in Obama’s speeches. The results are also shown in the figure.
From the figure, we can see Trump’s speech had high usage of the words “Americans,” “again,” “back,” and “great.” This is reflective of his inauguration speech, which was America-centric and was focused on making America great again and bringing things back to Americans.
Surprisingly one of the most frequent term in the three inauguration speeches is the adverb “not”, with Obama using it more often in his speeches than Trump. For example, it was used in Obama’s 13 speech in the following phrases: “our journey is ‘not’ complete until our wives…”; “‘not’ complete until our gay brothers…”; “‘not’ complete until no citizen…”
The adverbs “new” and “now” were also emphasized in all the inauguration speeches, perhaps indicating the presidents’ desires to bring in new things now or bring in change as presidents.
B. News press conference speeches
Moving a bit back in time from the inauguration speeches to the then president elects’ first news press conference, I analyzed how they used adjectives and adverbs. The analysis revealed that in his press conference, Trump used 5,95% adjectives while Obama used 6,97% and Trump used 7,79% adverbs while Obama used 5,61%.
In addition, I also looked at the top ten most frequent adjectives and adverbs. These are shown in the figures below.
From the figures, we can see the different usage of adjectives and adverbs. In particular, the adverb “very” is used significantly more by Trump than Obama. It was used by Trump in phrases such as “I am going to work very hard”; “I’m very proud..”; ” I look very much forward”; “… going to have a very, very elegant day.” From the press conference results, we can also see that there is a difference in the length of adjectives and adverbs used. Specifically, the average length of the adjectives and adverbs used by Trump is 4 characters while for Obama it is 5,8 characters.
In summary, this analysis has mostly served to reveal the actual usage of adjectives and adverbs in Trump’s speeches. It is interesting to see for instance the change in the top adjectives and adverbs used by Trump from the press conference to the inauguration speech. Notably, the adverb “very” was used significantly less in the inauguration speech. In addition, we can see that from all the speeches analyzed, there was a tendency for Trump to use more adverbs than adjectives when compared to Obama. However, due to the small sample of speeches analyzed, it is not possible to make any conclusive deductions. Further studies will need to be conducted.
When the 2015 and 2016 Academy Award nominations were released, many in Hollywood and on social media were deeply offended by the lack of racial diversity among the nominees, especially in the prominent categories of best actor / actress, and best supporting actor / actress, where only white actors and actresses were nominated. So did any changes take place in 2016 that are reflected in the 2017 nomination list?, especially the representation of people of color in the nomination list?
After the 2015 nomination announcement, the #OscarSoWhite and #OscarNorms hashtags began trending on Twitter as that was the first since 1998 that no person of color, Hispanic or Asian was nominated for the Academy Awards in the acting categories. Moreover, when the 2016 nominations were released and again the acting categories were only white people, the #OscarSoWhite hashtag resurfaced, with an outcry on social media and a boycott of the Oscars spearheaded by Jada Pinkett-Smith and Spike Lee. The outcry after the 2016 nominations was also a result from many feeling that 2015 had produced material that was worthy of nominations and that the Academy had passed over well-reviewed performances in the movies Creed, Straight Outta Compton and overlooked prominent actors of color like Idris Elba (Beasts of No Nation), Michael B. Jordan (Creed), Will Smith (in Concussion), and the many young actors in “Straight Outta Compton”. And even when there was nominations for these movies, only white people were nominated. For example, for the movie Creed, only Sylvester Stallone was nominated, while the film’s black writer-director, Ryan Coogler as well as the lead actor, Michael B. Jordan, were not nominated.
Because of the upset from the 2016 nominations, Academy president Cheryl Boone Issacs ushered in new membership rules and added 683 new members as a way to diversify a predominantly white, male and elderly group. The academy now numbers 6,687 people. These are the first Oscars voted since this change [source].
So did 2016 bring in new opportunities for diversity at the Oscars? The 2017 Oscar nominations were released last week on the 24th January and in this post I analyze the changes, if any, that have occurred in this year’s nominations in comparison to those of 2015 and 2016. For this post, I only analyze the nominees in the acting categories as well as the directing categories, this is because many on social media also felt that there were directors of color that were passed over by the Academy, for example Ava DuAvernay for her work in Selma.
Table below summarizes the nominees for the 2017 Oscars in the four acting categories.
In comparing the above nominees to previous two years, the Figure below shows the ethnic composition among the nominees in the four acting categories. The figure captures the distribution of white people (blue), people of color (orange) and other ethnicities – ‘other’ (grey).
From the figure above we see that there has been a positive change in the number of nominations for people of color in 2017 when compared to 2015 and 2016. Especially in the best supporting actress category, where majority of the actress nominated are black.
I further looked at the changes, if any, among the nominated directors. These include directors nominated in the Best Director category and the directors of the documentaries included in the Best Documentary Feature category. Figure below gives the distribution of white people (blue), people of color (orange) and other ethnicities (grey) in the years 2015 to 2017.
From the figure above, we see that the 2017 nomination list had a higher representation of persons of color than 2015 and 2016, especially for the Best Documentary Feature category. Notably, four out of the five directors in the nominated feature documentary are persons of color: Ava DuVernay, Raoul Peck, Roger Ross Williams, and Ezra Edelman. In particular, among the nominated directors for both film and documentaries, there is still a dominance of males, with only two females in 2015 (Laura Poitras and Rory Kennedy), one in 2016 (Liz Garbus) and one in 2017 (Ava DuVernay), all being in the Documentary Feature category. Ava DuVernay is actually the only director who is female and a person of color among the analyzed three years.
So, has there been more diversity among the 2017 nominees? Based on the analysis above, this year’s nominations definitely have a higher representation of persons of color in the acting and director categories than the previous two years. With a total increase from zero nominees in 2015 and 2016 to 11 nominees in 2017 (see Figure below). In particular, the biggest change is reflected among the best supporting actress and best feature documentary categories. However, There is still a small number of other ethinicities represented, even in the 2017 nominations.
There is no reason however to see these changes as due to the social media outcry or the boycott. Many of these movies have been years in the making and all the actors and actress are on those lists due to their own merits. More good quality movies directed, produced and acted by a diverse set of people will lead to more diversity in the Oscar nominations.
(P.s: If you notice any mistakes in the data above please let me know.)
If you are like me, you might have experienced long tiresome moments when browsing and searching for something interesting to watch on Netflix. Majority of this browsing is usually constant scrolling up and down through the images of the content until I find something that catches my eye. When I do, I usually read the story of the title, the actors and rating to see if its worth a try. But often, there is nothing that catches my interest and I quit or settle on an old Friend’s episode.
As a data collecting savvy company, I wondered what Netflix did with this user behavior and whether it performed any experiments to see how the imagery affects the content watched.
In following up with this wondering, I stumbled upon two articles from Netflix, detailing the experiments they do with content imagery as a way to identify ways to improve viewership. Netflix knows that with all the large amount of content they provide, they have a short time to capture the attention and interest of users. Particularly, since the human brain can process an image in as little as 13 milliseconds [1]. In addition, they understand that imagery of their content is the most efficient and compelling way to do that [2]. In one of their consumer research studies, done in 2014, they found that the imagery was the biggest influencer to a user’s decision to watch content, and that it also constituted over 82% of users focus while browsing the content. They also found that users spent an average of 1.8 seconds considering each content that is available on Netflix, which is a very, very short time.
Knowing this, Netflix thus conducts several experiments to try and find a ‘right’ imagery that captures the attention and interest of the users in that short amount of time. The experiments are usually run using A/B testing (explained here). During the experiments (detailed more here), Netflix collects various measurements such as click through rate, aggregate play duration, fraction of plays with short duration, fraction of content viewed, etc. [3].
In this post, however, I would like to share some of their key learnings from conducting imagery experiments as a way to improve their service offering [2].
1. Images showing faces with complex emotions outperform stoic or benign expressions. They identified that seeing a range of emotions actually compels people to watch a content more. This could be because complex emotions have a better ability to convey a large amount information regarding the tone or feel of the content. This was observed for instance in their testing of a ‘right’ image of the second season of Unbreakable Kimmy Schmidt.
2. Regional differences still exist, and are important for some content and imagery. A good example of when they observed the importance of regional presentation of a content and how it can impact its discovery among users around the world, was with the Sense8 TV Show. Sense8 has an international cast and storylines that give it a diverse appeal and makes it resonate with varying types of people. Thus, when developing the imagery for Sense8, this diversity was reflected in the final images, showing how much they varied between different countries and cultures.
3. Personally, I have thought that villains more than heroes make or destroy a movie, especially in the case of action movies. Thus it was not surprising to me that one of Netflix’s finding was that using visible, recognizable characters (and especially polarizing ones) results in more engagement. In particular, Netflix found that their users respond to villainous characters surprisingly well in both kids and action genres. For instance, in Dragons: Race to the Edge, the two images of villainous characters seen below significantly outperformed all others.
4. Three is apparently the upper limit of cast size one can show in the imagery. This is particularly for small sized artwork where a large cast size is not as effective in helping users decide to play a content. For huge billboards this might be the opposite though. During experimentation, Netflix observed this preference when they saw a drop tendency when an imagery contained more than three people. This finding directly informed their imagery for Orange is the New Black.
Season 1
Season 2
Season 3
Based on the experiments, it is clear to Netflix that using better images to represent content significantly increased overall streaming hours and engagement from their members [2]. Many of the above four findings are intuitively known by many of us Netflix users, but it is always interesting to read what companies are doing to improve their offering and product experience.
Sources:
[1] Trafton, Anne (16-01-2014), In the Blink of an Eye. MIT News. Retrieved on 23rd July 2016 http://news.mit.edu/2014/in-the-blink-of-an-eye-0116
[2] Nelson, Nick (03-05-2016). The Power of a Picture. Netflix Media Center. Retrieved on 26th June 2016, https://media.netflix.com/en/company-blog/the-power-of-a-picture
[3] Krishnan, Gopal (03-05-2016), Selecting the Best Artwork for Videos through A/B Testing. The Netflix Tech Blog, 26th June 2016, http://techblog.netflix.com/2016/05/selecting-best-artwork-for-videos.html
Having been working with in the area of data and text analysis, and experiment-driven software development for a couple of years now, combined with my occasional enjoyment of well-made TV shows, I naturally found myself listening to Sebastian Wernicke’s TED talk to the finish. The talk is about using data to make (smart) decisions. I found the talk quiet relevant in today’s world of big data, and increased availability and accessibility to software usage data. Big data has rapidly moved into many real-life decision making processes in the workplace, law enforcement, medicine, etc., where serious decisions are being driven or aided by data.
What I liked from Wernicke’s TED talk titled ‘How to use data to make a hit TV Show’ was that it was a reminder that even though access to huge data has opened up many opportunities in various fields, data is still just a tool and decisions should not be solely driven by it. Wernicke emphasizes that the thing between our ears, i.e., brain (taking into account that that thing has the expertise to make sense of what the data is saying), should be the driver of decision-making.
In the talk, Wernicke gives two examples from two very competitive and data-savvy companies (Amazon and Netflix), who both collect and analyze millions of data points from their customers/users, to illustrate his point. In one example, big data was used successfully (in the case of Netflix with the House of Cards TV show) and in another example, not so successfully (case of Amazon in their creation of the Alpha House TV show).
As Wernicke explains, when Amazon wanted to create a TV show, they started by taking various ideas from people. From those ideas, they selected eight TV show candidates. Then they made a first episode of each one of these eight shows and put them online for free for the public to watch. Then Roy Price (Head of Amazon Studios) and the team at Amazon recorded everything, i.e., from when somebody pressed play, pressed pause, what parts they skipped, what parts they repeated, etc. They collected millions of data points because they want to use those data points to then decide which shows they should make. They did all the data crunching from those millions of collected data points and an answer emerged. And the answer in this case was that “Amazon should do a sitcom about four Republican US Senators”, and they made that show. They used the data to drive their decision making and ended up with a show that was not so successful – ‘Alpha House’ (Alpha House has an IMDB score of: 7.6).
This not so successful case of Alpha House was compared by Wernicke to the more successful story of Netflix in their creation of House of Cards (House of Cards has an IMDB score of: 9.0). Netflix approach was to start by looking at all the data they already had bout their viewers such as the viewer ratings, viewing history, and so on. Then they used that data to explore and discover little bits and pieces about the audience: what kinds of shows the viewers liked, the producers they liked, the actors, etc. With all these pieces collected, they took a risk and decided to license a drama series bout a single senator which was ‘House of Cards’.
Wernicke uses these two examples to explain the difference in how data can be used to make decisions. In the talk, he continues to explain that whenever we, as humans, are solving complex problems, we are essentially doing two things: The first is to break that problem into bits and pieces so that we can deeply analyze each of those bits and pieces. The second part involves then putting all these bits and pieces back together to come to our solution – and sometimes, this is an iterative process. Data and data analysis are only good for the first part, that is, no matter how powerful that data and data analysis is, it can only help us in taking a problem apart and understanding its pieces. It’s not suited to putting those pieces back together again and then to come to a conclusion. Wernicke points out that there is another tool that can put the pieces back together, and its available to all of all of us, this tool of course is the brain, and one of the things it is good at, is taking those bits and pieces back together again, even when there is incomplete information, and coming to a good conclusion. But to come to a good conclusion, that brain has to have some expertise.
Of course data helps us see what we might miss, find new avenues or business ideas. Thus in our data analysis work, we must get the balance right. Yes, “more data is better and can deliver brilliant insights, but in the end it has to be integrated by expert human brains for complex issues like producing a brilliant TV show”, Wernicke states. Humans as decision makers still need to be part of the data analysis equation, but what this also means for data scientists is also to have the expertise to make ‘often’ right conclusions or risks, Wernicke adds. The sentiment of the brain as the decision maker was also echoed by Beverly Wright, executive director at the business analytics center at Georgia Tech, in a Keynote Panel Discussion at Global Big Data Conference [Source].
From the two examples that Wernicke gives, making the right conclusions often as a data scientist or knowing when to take risks, comes with practice. For instance, from the time when those two TV show examples were created, both companies have learned a lot since then. For example, this year, 2016, Amazon had two original series nominated for the golden globe awards.


 how such capabilities, i.e., constantly knowing what your child is looking at, having the power to filter and even know body conditions before the child does, goes wrong for both the mother and daughter. We see the daughter want to experiment with things, start to need her privacy as well as lie as teenagers would do, and we see the mother struggle with the need to know, control and filter the daughter. In a way, I actually think the mother became addicted to the device and the constant need of knowing what was the child was doing.
 , we can perhaps all understand why the husband and wife would make the decision to have the wife’s consciousness transferred in the husband. Who would not give their loved one the chance to talk, see and hug their child if they could? But having someone constantly commenting and criticizing what you look at, what you do, how your body reacts – all this on top of your own critical voice is a recipe for disaster, and we see in this story how it all goes wrong.


 and text analysis as a beginner.
  Finland and by the several companies that have started as a result of it, for example,


 news, etc., and supporting basic rights of free speech online. With the increase in aggressive, terrorism, cyberbullying, hate speech, and racist communication, as well as expressions of depression or suicidal thoughts on social media, there are however increased pressures and incentives on these organizations and researchers (like myself) to develop fully or semi-automated methods to detect these negative behaviors. However, as pointed out in my
 s almost two billion users and use of sophisticated algorithms, privacy and ethical rights are always a question mark. This year, for example, it introduced a semi-automated depression detection algorithm that analyzes and spot patterns of posts that are potential suicidal, and then sends them to the Facebook team for appropriate response [1, 2]. Earlier, this identification process used to be only manual.


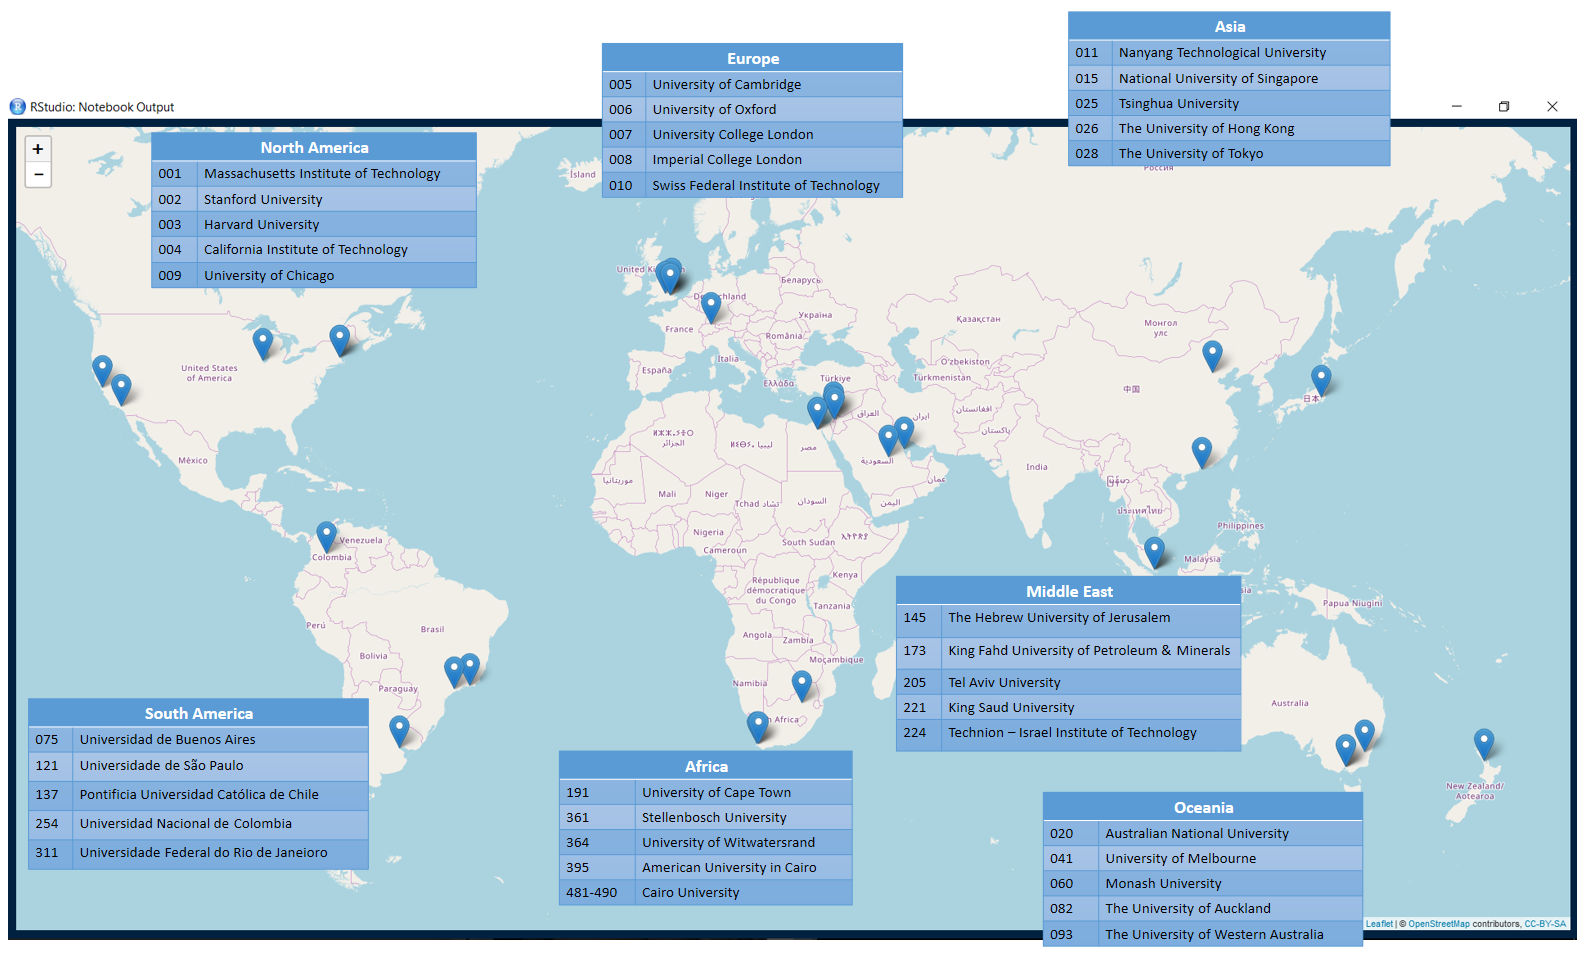
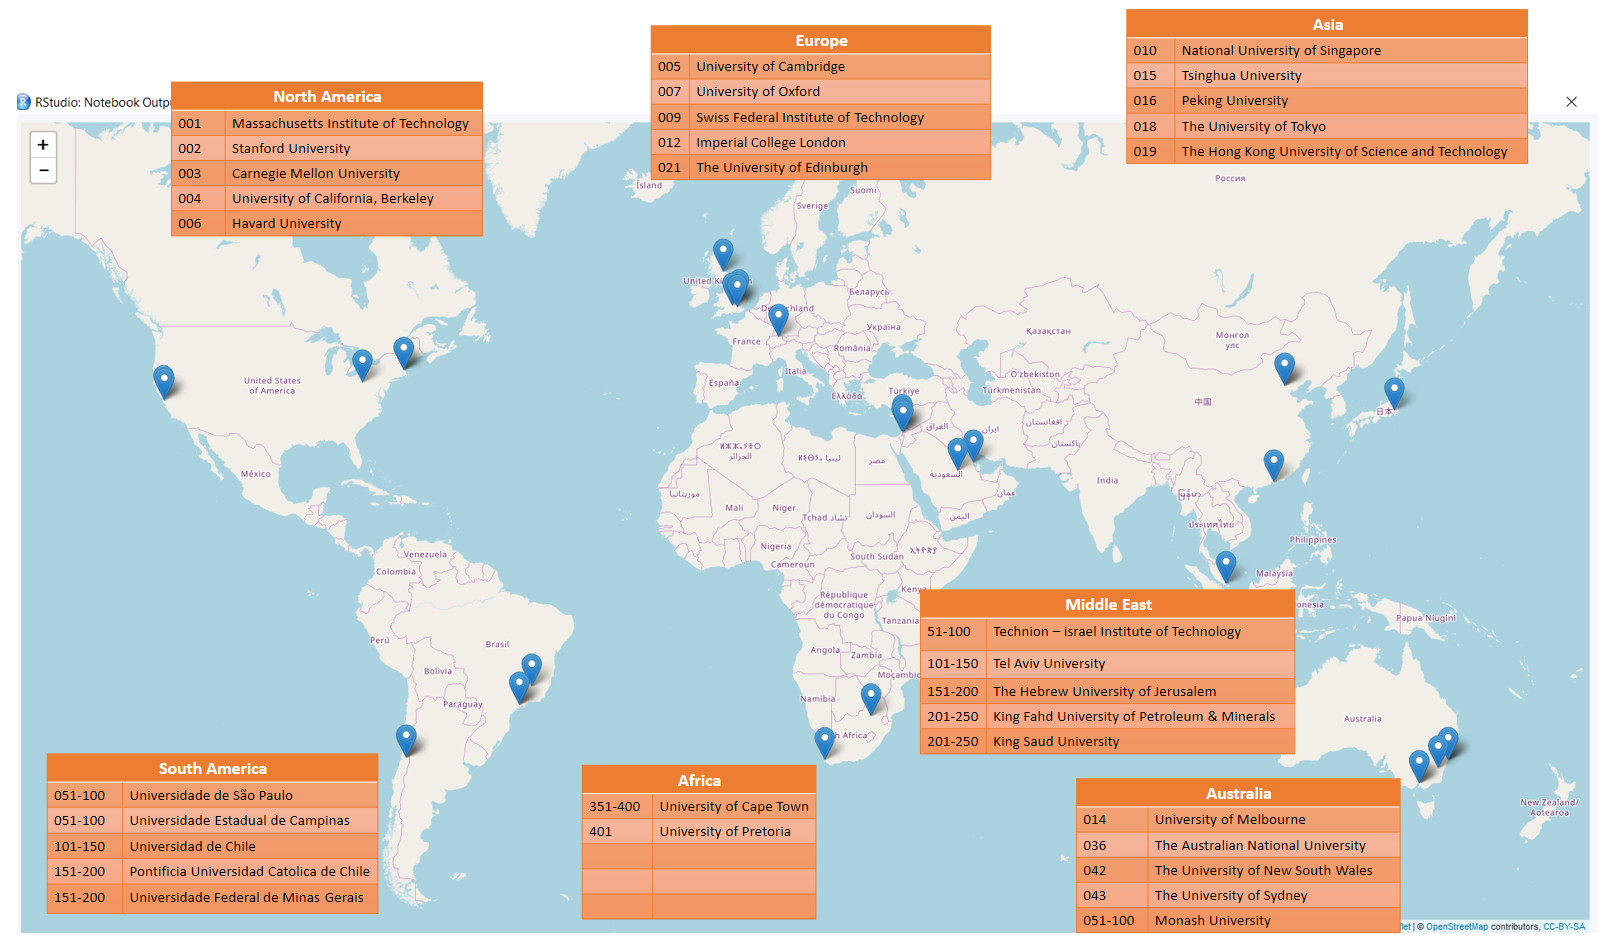