In my last post I presented tips on designing dashboards, one of them was stealing like an artist, which I have done in this one :). I came across one Tableau Zen Master’s work and loved how their dashboards popped, although I can’t for the life of me remember their name. The dashboards were simple and elegant, and I wondered how he got to create such beautiful dashboards. I downloaded some of his dashboards, did a bit of reverse engineering to understand how he had done it. After a bit of time and tinkering, voila! this is my result. A simple but elegant dashboard that showcases the amount of trade Finland does with different regions around the world.
I remembered the tips from the last post, I used the grid, avoided clutter, used big ass numbers, etc.
In my learning, I always try to use data sets where I am also genuinely curious about the data. One of the things that Think Africa does is look at enhancing the collaboration between Finland and African countries and currently how we can be more involved in the Finland-Africa Strategy. For us to do this well, we need to understand the amount of the current collaboration, which also includes the Trade.
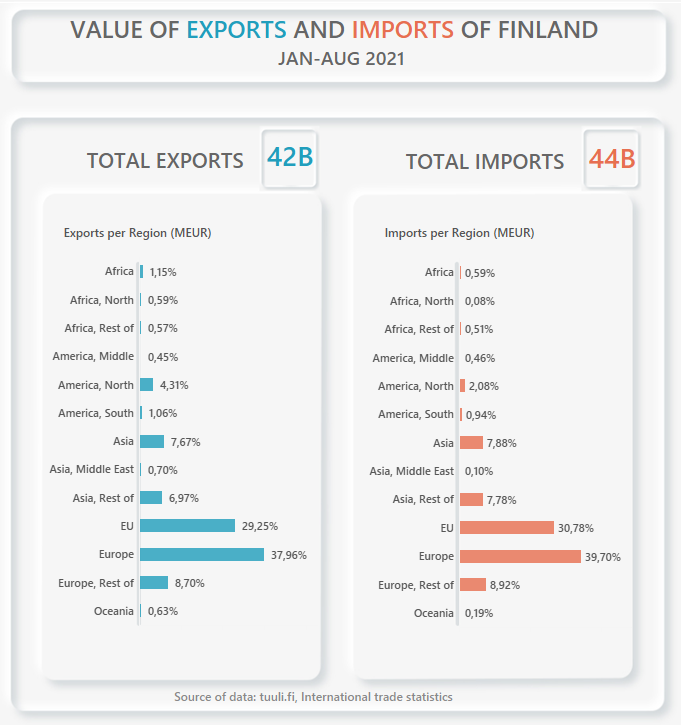
I used the trade statistics data from tuuli.fi. From the dashboard, we can see that out of the total exports of Finland, 1,15% is to Africa at a rank of 4 when comparing the continents (1 = Europe, 2 = Asia , 3 = North America, 4 = Africa, 5 = South America, and = Oceania). Majority of the Exports are also with North Africa when compared to the rest of Africa. Looking at the Imports, Africa ranks 5th, at 0,59%.
Thus from these numbers, there is still a lot to do in increasing Trade between Finland and African countries.
In Future this Dashboard will be improved to include a filter for time to see whether there are any improvements over time.
Also published on Medium.