It is expected that in any country, immigrants will fair off worse on several indicators than the natives. In this post, using the European Union Migration integration Statistics (available here), I created an interactive Tableau Dashboard to look at how EU countries perform in comparison to each other in terms of the employment and social inclusion indicators, with a particular interest on Finland and it’s performance when it comes to those foreigners with a non-EU background. Indicators that interest me a lot but also ones we (Think Africa) often focus on when we look at integration.
“Successful integration of migrants into society in the host country is a key element for maximising the opportunities of legal migration and making the most of the contributions that immigration can make to development.”
Source: eurostat: Migrant integration statistics – labour market indicators
The EU Agenda has in the recent years placed great importance on the integration of non-EU migrants, since successful integration and the fight against poverty and social exclusion is necessary for maximising the economic and social benefits of immigration for individuals as well as societies (Migrant integration statistics: labour market indicators and at risk of poverty and social exclusion).
Data used is that collected from EU member states in 2020, with partial information or limited reliability in some member states. The employment and at risk of poverty and social exclusion data is available according to Country of background and Gender. Country of background is divided into three categories; Natives, EU foreigners, and non-EU foreigners. Unfortunately the data does not go further to give the specific country background which would have allowed me to look at e.g., differences among the non-EU foreigners from different continents.
Interactive Dashboard is available >> here
Employment rates:
Similar to the experiences found in Finland, in many of the EU member states migrants make up a significant part of the workforce. Many arrive with skills that are highly needed in the labour markets but they often face difficulties in having them valued and finding jobs that reflect their skills level (Action plan on Integration and Inclusion 2021-2027 ).
According to the Eurostat data, in 2020 the EU unemployment rate for working age people (defined in the statistics as people aged 20 to 64 years) was 13.9 % for those born outside the EU, 8.1 % for those born in another EU Member State and 6.1 % for the native-born population. More than double the rate of the non-EU foreign unemployed rate in comparison to natives.
Observations from the Dashboard:
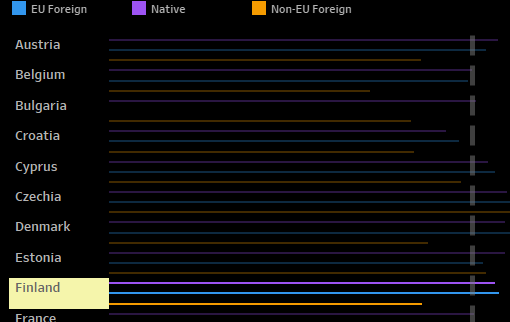
In Finland, the employment rate is 78,1% for Natives, 77,3% for EU foreigners and 62,7% for non-EU foreigners. For the two former values, they are above the EU averages, while for the non-EU foreigners, the figure is below that of the EU average = 66,82%. This trend of a lower employment rate among non-EU foreigners is observed in nearly all EU member states for which data are available (no data for Romania).
As expected, the gap between the employment rates for the Native-born population and persons born elsewhere in the EU was often smaller than that observed between the native-born population and those born outside the EU. However, an analysis of Finland confirms that the gap is among the wider ones when compared to the other EU countries. Looking at the gap between the Natives and EU foreigners, Finland is 9th from the bottom with a gap of 14,6 percentage points. While the gap between EU-foreigners and non-EU foreigners is 5th from the bottom with 15,4 percentage point difference (see Figure 1). Noticeably, many of the Nordic countries are in the bottom five. Czechia is the only country where the employment of non-EU foreigners is higher than that of Natives. Will be interesting to understand why.

At risk of poverty and social exclusion:
Inclusion for all is about ensuring that all policies are accessible to and work for everyone, including migrants and EU citizens with migrant background.
Source: Action plan on Integration and Inclusion 2021-2027
Many EU countries have inclusion strategies to ensure that every citizen may fully participate in society (Migrant integration statistics). Unfortunately many citizens of foreign background, are not yet participating in society in their fullest potential.
The at risk data also pertains to those of working age (20 to 64 years), analysed according to Country of birth and Gender.
Observations from the Dashboard:
In terms of at risk of poverty and social exclusion rates, Finland performs better than it does on employment when it comes to foreigners. Looking at the gap between the Natives and EU foreigners, Finland is 14th from the bottom with a gap of 16,7 percentage points. While the gap between EU foreigners and non-EU foreigners is 10th from the bottom with 13,9 percentage point difference. In comparison to the employment data, when analysing the gaps between EU and non-EU foreigners, only two Nordic countries are in the bottom five (Norway and Sweden) versus the four that we saw (Sweden, Denmark, Norway, and Finland (see Figure 2).
Among people in Finland, 15,4% of Natives, 18,2% of EU foreigners, and 32,1% non-EU foreigners faced the risk of poverty or social exclusion in 2020. That is the risk of monetary power was approximately twice as high for non-EU foreigners. Generally, a higher share of foreign citizens were at risk of poverty or social exclusion in 2020 when compared to natives with Czechia and Hungary seeming to be exceptions. (incomplete information for Romania). In comparison to the EU average, Finland performs better than the average for Natives (18,39%), EU foreigners (23,09%), but approximately the same as the average for non-EU foreigners (32,41%).

From the observations above, we can see that among the Native and EU foreigners, Finland performs well in terms of labour market integration and social inclusion, but there is still a lot of improvement to be done among those with a non-EU background.