I had heard that it was possible to tailor Tableau Dashboards for mobile but I had never tried it. I often created larger, landscape sized Dashboards that colleagues access on Desktop or laptop. However, I believe that many who read my blogposts published either through my website or Medium access it on mobile devices. This made me think about how I could start providing a better mobile experience for my Dashboards.
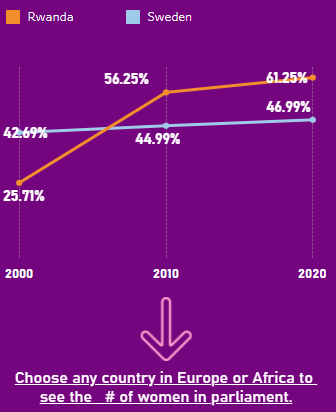
Inspired by the International Women’s day and wishing to explore and tell a story on this day, I embarked on a journey to create a mobile-friendly Tableau Dashboard. Motivated by the fact that I was born in a country that now ranks number one in the world for the most women in Parliament (Rwanda)and that I live in a country that is ranked the happiest in the world (Finland), I explore if there is any relation between Women in Parliament and the Happiness Index. Not only on the happiness Index but the Human Development Index as well.
The magic was actually just at the Dashboard creation stage, i.e., the worksheets are created normally (of course keeping in mind that any visualization you create is being accessed on a much smaller screen). Then when you reach the stage of creating the Dashboard, you define the layout for different platforms. This was a good tutorial I followed.
Check it out HERE. Note: This version is best viewed on Mobile.