This is Part II, a continuation of the Data analysis of the Africa, Europe, and Asia-Pacific 2018 Index of Economic Freedom data – Part I
In the first part I explored the:
1. distribution of nations in Africa (where I am from), Europe (where I am currently living) and Asia (where the economic freedom leading countries are) among the 5 categories of freedom, and
2. correlations between economic variables to see if any insights can be gained from this data.
In this post, I explore the
3. relationship between economic freedom, government expenditure and unemployment rates.
and summarize the findings and give recommendations.
The aim of this data exploration is to obtain insights and identify potential areas for improvement, especially for African nations. For the analysis, I used python. Full code is available on github.
Relationship between economic freedom, government expenditure and unemployment
Reducing unemployment is something that personally interests me. Thus in this post I focus on the relationship between the economic freedom, government expenditure and unemployment rates as a percentage of the labor force. Previous work has stated that government spending should go towards improving economic situations including employment levels (read John Maynard Keynes’ work).
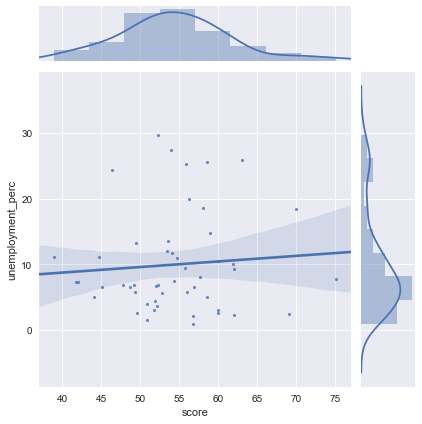
According to the 208 Index data, the average unemployment rate is 10.08% in Africa, in Europe it is 9.8% and in Asia-Pacific it is 5.1%, the lowest among the three regions. The graphs below plot the economic freedom score vs unemployment rate data points and show the trend as well as their distributions.
Trend in Africa. As can be seen in the graph below, there is a slight upward trend between the economic freedom score and unemployment rate in Africa which is not the case in the European and Asia-Pacific graphs (see below). In the graph we also see several countries with similar economic freedom scores (scores between 50 and 60) but have very varying unemployment rates. The highest unemployment rate is present in Gambia at 29.7%. while the lowest is in Benin at 1%.

Trend in Europe. In the graph below, we see that there is a downward trend between the economic freedom score and unemployment rate in Europe. A bit interesting, the lowest unemployment rates is found in Belarus at 0.5% but Belarus is categorized as moderately unfree. The highest unemployment rate of 26.7% is in Macedonia.

Trend in Asia-Pacific. Asia-Pacific also has a downward trend between the economic freedom score and unemployment rate. The region has some of the lowest unemployment rates when compared to the Europe and Africa regions. However, the highest unemployment rate is 31% in the Solomon Islands, the highest rate also when compared to those nations in Europe and Africa. The lowest unemployment rate is 0.3% in Cambodia.

Now, looking at the government spending, the average African government spending (graded on a scale of 0 to 100 in the Index) is 72.69, whereas it is 45.05 and 68.51 in Europe and Asia-Pacific respectively. Thus, the government spending in Africa is considerably higher. Moreover, the average government spending as a share of the GDP per person (an indicator of the size of government across countries (source)) is at 25 in Africa, which is higher than both Hong Kong (18) and Singapore (17.7) which are the first and second nations respectively in the economic freedom rankings.
Thus looking at the level of spending in Africa, and other variables such as unemployment rates or the economic freedom score, we can see that it is not the amount of spending that only matters to improve the economic freedom but the quality of the spending. “Things like the rule of law and a relatively corruption-free political culture—is more important than their size.” Stephen Gordon. As was pointed in the Index report, African nations need to strengthen their rule of law, protection of property rights, and curb down on cronyism and corruption.
Thus, spending itself is not the solution to reducing unemployment rates or improving the economic freedom score. The best results are likely to be achieved instead through strengthening and encouraging more business freedom, trade freedom, investment and financial freedom, aspects that create opportunities.
Summary
Part I and this post have explored the 2018 Index of Economic Freedom data, in particular looking at the Africa, Europe and Asia-Pacific specific data. The findings have revealed relationships, similarities and differences among the three regions. The aim of the exploration was to gain insights and identify potential areas for improvement, especially for African nations.
From looking at the correlations, it was possible to identify areas that could be worked on by African economies. This can include creating policies to improve regulatory efficiency (business freedom, labor freedom, and monetary freedom) and create market openness (trade freedom, investment freedom, and financial freedom), policies that can provide the best chance of translating opportunity into prosperity.
In future, I aim to expand on the analysis to include more data sets (public and private sector) that can hopefully provide even more insights.
Also published on Medium.