According to the 2018 Index of Economic Freedom, released by the Heritage Foundation, the world is moderately free. The Index, which was launched in 1995, evaluates nations on 12 aspects that affect economic freedom. These are grouped into four broad policy areas; 1) Rule of law (property rights, judicial effectiveness, and government integrity); 2) Government size (tax burden, government spending, and fiscal health); 3) Regulatory efficiency (business freedom, labor freedom, and monetary freedom); and 4) Market openness (trade freedom, investment freedom, and financial freedom).
Each freedom variable is a value between 0 and 100. Values of these 12 freedoms are averaged to create an overall economic freedom score. Based on this score, nations can be classified into five categories: free (>= 80), mostly free (70-79.9), moderately free (60-69.9), mostly unfree (50-59.9), and repressed (< 50).
Those economies that are rated free or mostly free enjoy higher per capita incomes than the many other nations that are not economically free. Examples of these free nations include Hong Kong and Singapore which have been leading in the rankings for several years.
Using the 2018 Index data, I explore the:
1. distribution of nations in Africa (where I am from), Europe (where I am currently living) and Asia-Pacific (where the leading countries are) among the 5 categories of freedom,
2. correlations between economic variables to see if any insights can be gained from this data, and
3. relationship between economic freedom, government expenditure and unemployment rates.
The aim of this data exploration is to obtain insights and identify potential areas for improvement, particularly for the African nations. The analysis on the Finland-Uganda Data Science Meetup, Session 1 that I instructed on the 29th March. The session explored the relationship between African nations’ government expenditure and unemployment rates using simple linear regression.
I have split the analysis and results into two posts. This post, Part I, covers the 1st and 2nd exploratory items mentioned above. Part II covers the 3rd item and summarizes the findings and gives recommendations. For the analysis, I used python. Full code is available on github.
Categorization of nations
As mentioned, the economic freedom score can be used to categorize the nations. Figures below show the distribution of the nations into the five categories of freedom.
World nations categorization. A total of 180 economies were ranked in the 2018 Index, and have an average score of 61.07 (Moderately free), a slight improvement of 0.17 points from the previous year. This is also the highest score in the 24-year history of the Index. From the chart below we can see that majority of the World’s nations fall in the moderately free and mostly unfree categories.

African nations categorization. Total of 53 economies were ranked in the 2018 Index, and have an average score of 54.46 (Mostly unfree), a slight drop of 0.49 points from the previous year (54.95). The graph below shows the distribution. Visible is that the distribution skews more to the right with majority of the nations being mostly unfree. Noticeably there are no African nations that are considered free. Mauritius is the only mostly free nation, with Botswana falling short of that category by only a 0.2 point drop from 2017, causing it to drop into the moderately free category.

European nations categorization. Total of 45 nations were ranked in the 2018 Index, and have an average score of 68.78 (Moderately free), a slight improvement of 0.80 points from the previous year (67.98). Majority of the nations in Europe are moderately free. Noticeably, Europe has zero nations that are considered repressed.

Asia-Pacific nations categorization. A total of 43 nations were ranked and have an average score of 61.05 in 2018, a bit higher than the average of 60.43 in 2017. Asia-Pacific leads in the number of countries that are considered free, with a total of four nations. Majority of the countries are however mostly unfree.

Correlations among the 2018 Index economic variables
The 2018 Index data includes 28 numerical variables which include the 12 freedoms, as well as other variables such as GDP per Capita, Unemployment rates, inflation, or public debt.
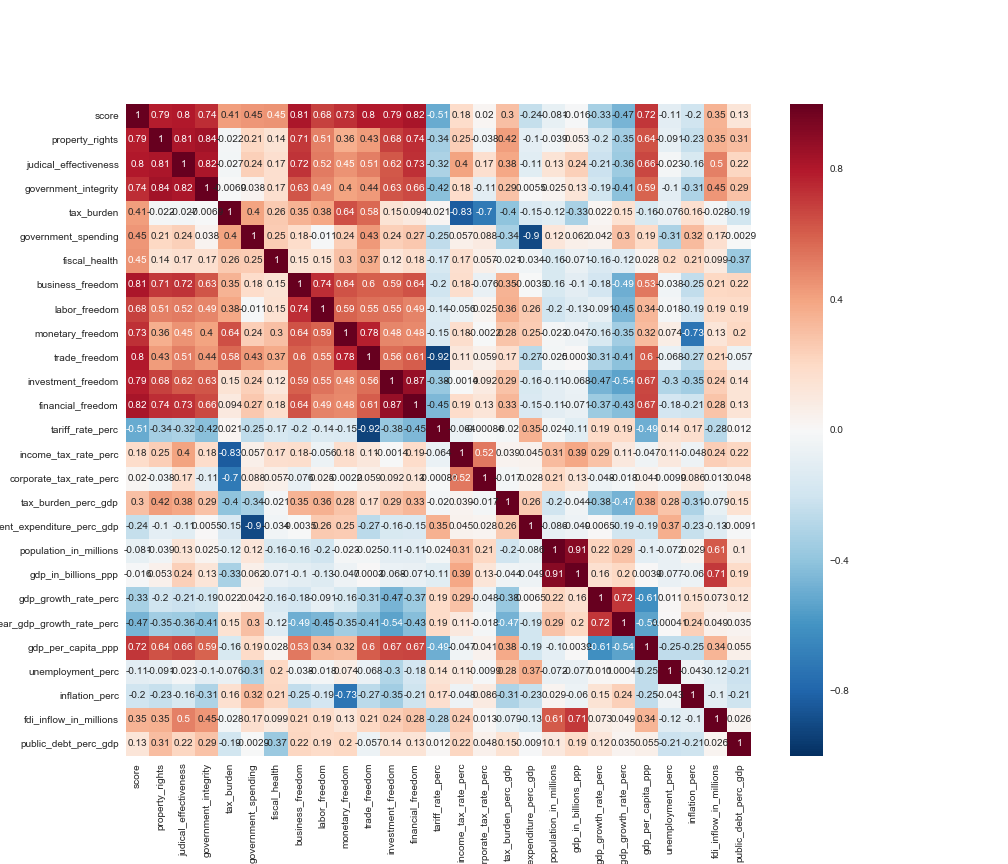
The heatmaps below reveal the correlation coefficients, i.e., the relationship between these variables in the African, European and Asia-Pacific regions. Looking at the heatmaps, we can see those variables that are positively and negatively correlated.
Correlations of variables in African nations (download image)

Correlations of variables in European nations (download image)

Correlations of variables in Asia-Pacific nations (download image)
From the heatmaps, what is immediately visible, is the higher amount of positive correlations on the Europe and Asia-Pacific heatmaps. In all three regions, there is higher positive correlation among the Rule of law economic variables, i.e., property rights, judicial effectiveness, and government integrity. With the Asia-Pacific and European heatmaps, one can see that higher positive correlations also exist in the Regulatory efficiency (business freedom, labor freedom, and monetary freedom) and Market openness (trade freedom, investment freedom, and financial freedom) variables. In Asia-Pacific particularly, these three categories are all highly correlated to the economic freedom score. Of course correlations do not imply causality, but this does highlight areas such as regulatory efficiency and market openness that African nations can work on and create policies that have a positive impact on the economic freedom score.
An aspect that further interests me is the relation between economic freedom and employment opportunities for citizens. In the next part, I particularly look at the relation between economic freedom and government expenditure and how these relate to unemployment rates in African, European and Asia-Pacific nations.
Also published on Medium.