I have written before about the importance of visualizations in communicating insights (here). Having the skill to create beautiful and insightful visualizations is a great arsenal to have in one’s pocket and I always wish I had more time to hone that skill. Although creating visualizations is part of my everyday data analysis work, from using them to explore the data, look for trends and correlations, to reporting insights and findings, I don’t really get a good chance to be creative. And when I say creative, I mean this or this or this. Thus, when our Data Strategy team at F-Secure created a visualization competition titled “Beauty in Data”, I got excited about the opportunity to try something new.
The competition was part of a bigger strategy to move the whole company towards being more data driven. It ran in June and one had two weeks to make a submission. It unfortunately was not great timing for me. I was so busy during those two weeks that I almost changed my mind about participating. But I wanted to take part, having never competed before in a data analysis related challenge, I wanted to challenge myself to be creative and also observe what other submissions would come up with given the same dataset. Thus I entered the competition knowing very well that I wouldn’t win.
We were given four data sets containing information on customers, customer activity data, sales, and product usage. The data was based on real data models and processes and utilized real terminology. However, the data was 100% fabricated and did not relate to reality in any way. The task then was to find insights from these four data sets, things that could be interesting and then create a set of visualizations to communicate these insights. Although the insights were important, it was the style of the visualizations that was key. The audience/judges in this scenario were business leaders about to make an “investment” decision based on our findings, but with little knowledge. One got extra points if they used F-Secure’s brand colors in their visualization.
We were allowed to use any tool of our choice. I chose to use Tableau as it’s a popular business Intelligence tool, with a strong community and has interesting features that I don’t get to try in my everyday work. I use Tableau as part of my work usually to create reports. But I find that many of the reports I create tend to be similar and basic, and just communicate what needs to be communicated. But one can do so much more interesting visualizations with Tableau, just look at some of the examples here.
For the competition, I decided to try the Story feature of Tableau, which is a sequence of visualizations that work together to convey a narrative. It’s not a complicated feature to work with, but it forces one to think of an interesting narrative you want the visualizations to tell and then create that.
I didn’t win, as expected (good visualizations do need time) but I was pleasantly surprised by the feedback that I received from the judges. I was told that it was a favorite among some of them as it “provided clear insights to a clear problem.” Adding that my submission was “a textbook example on how one should do visualizations”.
This screenshot was shared with me where the judges pointed out that “with 1 click, the visualization directly provides insights in regards to a specific product and how its sales have performed.”

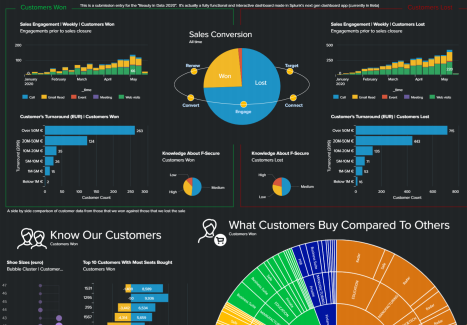
Although I was happy with the feedback, I realized I still had to put more effort into getting out of my comfort zone and thinking out of the box with visualizations, especially after I saw some of the other entries (see below):


So although my submission did not display so much beauty, I learned a lot. The challenge helped me learn a new Tableau feature, and from seeing the other submissions as shown above, I learned what was possible with using other tools such as Splunk, which I have never used before.
This is how I usually learn new tools or features, by using a fun problem that inspires and challenges me to solve it. And if you are anything like me and you want to learn something new, I would advise to look for fun problems that interest you and motivate you to solve them with features and tools that you want to learn.
Let’s see what next year’s competition will inspire me to learn 😊